Scotch-Irish vs Slovak In Labor Force | Age > 16
COMPARE
Scotch-Irish
Slovak
In Labor Force | Age > 16
In Labor Force | Age > 16 Comparison
Scotch-Irish
Slovaks
63.3%
IN LABOR FORCE | AGE > 16
0.0/ 100
METRIC RATING
309th/ 347
METRIC RANK
63.9%
IN LABOR FORCE | AGE > 16
0.1/ 100
METRIC RATING
285th/ 347
METRIC RANK
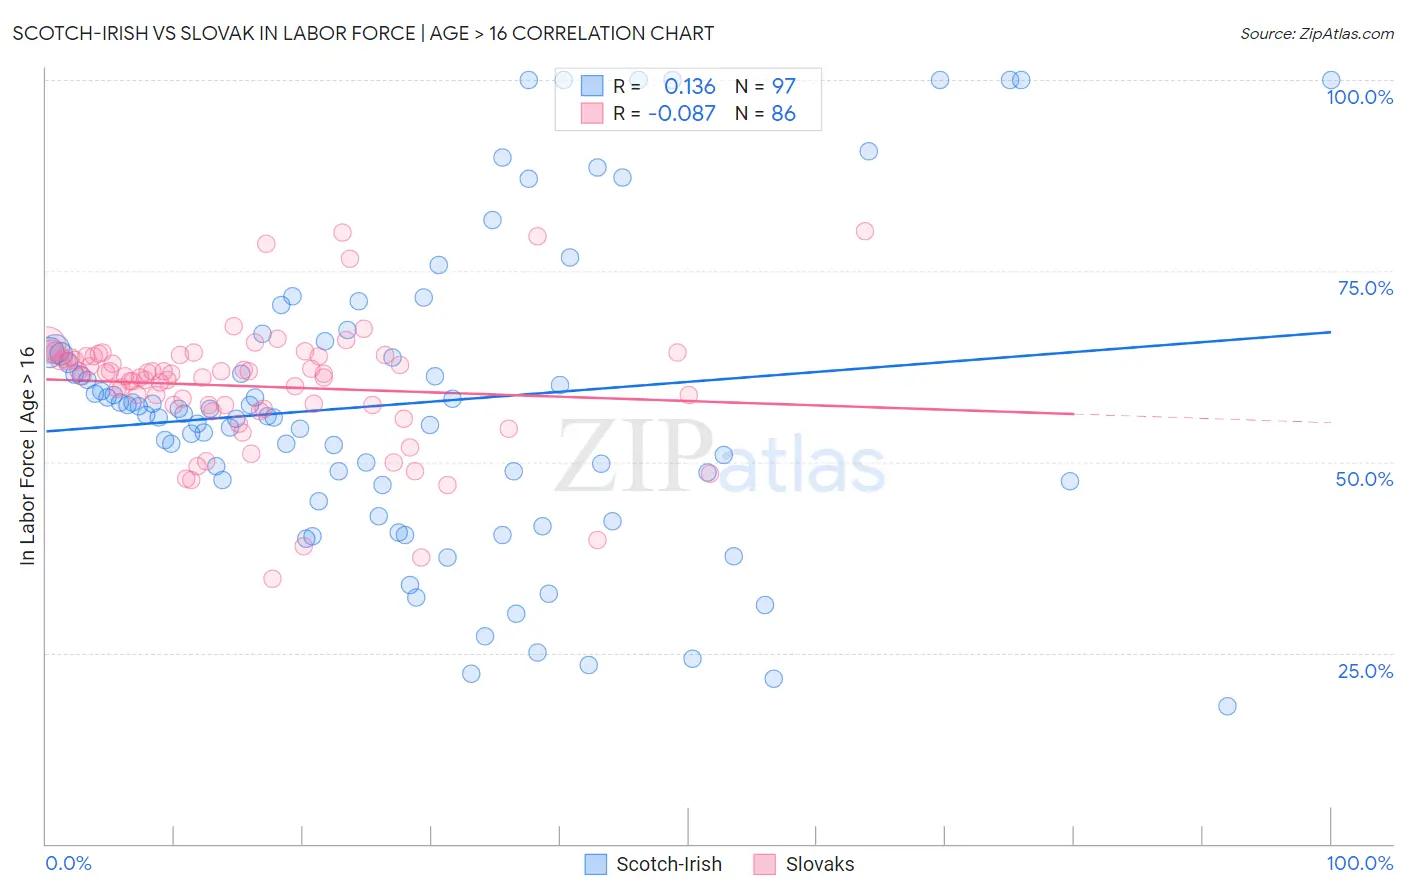
Scotch-Irish vs Slovak In Labor Force | Age > 16 Correlation Chart
The statistical analysis conducted on geographies consisting of 548,771,669 people shows a poor positive correlation between the proportion of Scotch-Irish and labor force participation rate among population ages 16 and over in the United States with a correlation coefficient (R) of 0.136 and weighted average of 63.3%. Similarly, the statistical analysis conducted on geographies consisting of 397,893,626 people shows a slight negative correlation between the proportion of Slovaks and labor force participation rate among population ages 16 and over in the United States with a correlation coefficient (R) of -0.087 and weighted average of 63.9%, a difference of 0.98%.
In Labor Force | Age > 16 Correlation Summary
| Measurement | Scotch-Irish | Slovak |
| Minimum | 18.0% | 34.7% |
| Maximum | 100.0% | 80.2% |
| Range | 82.0% | 45.5% |
| Mean | 57.6% | 59.9% |
| Median | 56.2% | 61.4% |
| Interquartile 25% (IQ1) | 47.2% | 57.4% |
| Interquartile 75% (IQ3) | 64.5% | 63.8% |
| Interquartile Range (IQR) | 17.3% | 6.4% |
| Standard Deviation (Sample) | 19.8% | 8.2% |
| Standard Deviation (Population) | 19.7% | 8.2% |
Similar Demographics by In Labor Force | Age > 16
Demographics Similar to Scotch-Irish by In Labor Force | Age > 16
In terms of in labor force | age > 16, the demographic groups most similar to Scotch-Irish are Shoshone (63.2%, a difference of 0.070%), Blackfeet (63.2%, a difference of 0.080%), Pennsylvania German (63.4%, a difference of 0.13%), Iroquois (63.2%, a difference of 0.14%), and Central American Indian (63.4%, a difference of 0.17%).
| Demographics | Rating | Rank | In Labor Force | Age > 16 |
| Delaware | 0.0 /100 | #302 | Tragic 63.6% |
| Cree | 0.0 /100 | #303 | Tragic 63.5% |
| Immigrants | Nonimmigrants | 0.0 /100 | #304 | Tragic 63.5% |
| Osage | 0.0 /100 | #305 | Tragic 63.5% |
| Blacks/African Americans | 0.0 /100 | #306 | Tragic 63.4% |
| Central American Indians | 0.0 /100 | #307 | Tragic 63.4% |
| Pennsylvania Germans | 0.0 /100 | #308 | Tragic 63.4% |
| Scotch-Irish | 0.0 /100 | #309 | Tragic 63.3% |
| Shoshone | 0.0 /100 | #310 | Tragic 63.2% |
| Blackfeet | 0.0 /100 | #311 | Tragic 63.2% |
| Iroquois | 0.0 /100 | #312 | Tragic 63.2% |
| Chippewa | 0.0 /100 | #313 | Tragic 63.1% |
| Yaqui | 0.0 /100 | #314 | Tragic 63.0% |
| Potawatomi | 0.0 /100 | #315 | Tragic 62.8% |
| Yup'ik | 0.0 /100 | #316 | Tragic 62.7% |
Demographics Similar to Slovaks by In Labor Force | Age > 16
In terms of in labor force | age > 16, the demographic groups most similar to Slovaks are French (63.9%, a difference of 0.030%), Immigrants from Austria (63.9%, a difference of 0.030%), Scottish (63.9%, a difference of 0.030%), Immigrants from Germany (63.9%, a difference of 0.040%), and Spanish (63.9%, a difference of 0.070%).
| Demographics | Rating | Rank | In Labor Force | Age > 16 |
| Assyrians/Chaldeans/Syriacs | 0.3 /100 | #278 | Tragic 64.0% |
| Welsh | 0.2 /100 | #279 | Tragic 64.0% |
| Immigrants | St. Vincent and the Grenadines | 0.2 /100 | #280 | Tragic 64.0% |
| French Canadians | 0.2 /100 | #281 | Tragic 64.0% |
| Immigrants | Guyana | 0.2 /100 | #282 | Tragic 64.0% |
| Immigrants | Germany | 0.1 /100 | #283 | Tragic 63.9% |
| French | 0.1 /100 | #284 | Tragic 63.9% |
| Slovaks | 0.1 /100 | #285 | Tragic 63.9% |
| Immigrants | Austria | 0.1 /100 | #286 | Tragic 63.9% |
| Scottish | 0.1 /100 | #287 | Tragic 63.9% |
| Spanish | 0.1 /100 | #288 | Tragic 63.9% |
| Celtics | 0.1 /100 | #289 | Tragic 63.8% |
| Hungarians | 0.1 /100 | #290 | Tragic 63.8% |
| Nepalese | 0.1 /100 | #291 | Tragic 63.8% |
| Spanish American Indians | 0.1 /100 | #292 | Tragic 63.8% |