Guamanian/Chamorro vs Malaysian Householder Income Under 25 years
COMPARE
Guamanian/Chamorro
Malaysian
Householder Income Under 25 years
Householder Income Under 25 years Comparison
Guamanians/Chamorros
Malaysians
$53,423
HOUSEHOLDER INCOME UNDER 25 YEARS
95.3/ 100
METRIC RATING
120th/ 347
METRIC RANK
$51,615
HOUSEHOLDER INCOME UNDER 25 YEARS
19.7/ 100
METRIC RATING
190th/ 347
METRIC RANK
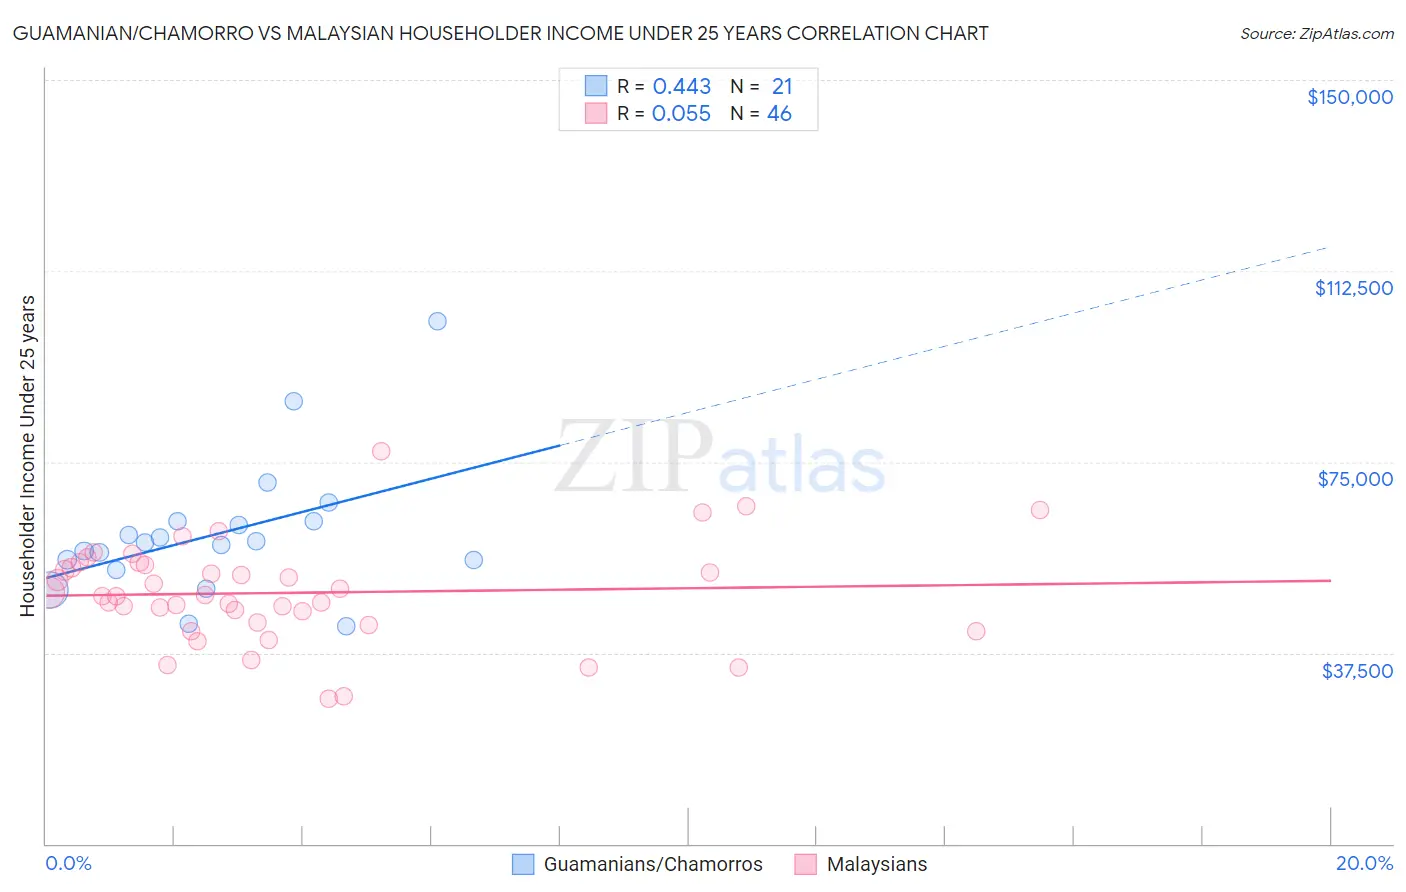
Guamanian/Chamorro vs Malaysian Householder Income Under 25 years Correlation Chart
The statistical analysis conducted on geographies consisting of 200,760,858 people shows a moderate positive correlation between the proportion of Guamanians/Chamorros and household income with householder under the age of 25 in the United States with a correlation coefficient (R) of 0.443 and weighted average of $53,423. Similarly, the statistical analysis conducted on geographies consisting of 207,003,790 people shows a slight positive correlation between the proportion of Malaysians and household income with householder under the age of 25 in the United States with a correlation coefficient (R) of 0.055 and weighted average of $51,615, a difference of 3.5%.
Householder Income Under 25 years Correlation Summary
| Measurement | Guamanian/Chamorro | Malaysian |
| Minimum | $42,829 | $28,500 |
| Maximum | $102,571 | $77,081 |
| Range | $59,742 | $48,581 |
| Mean | $60,959 | $49,286 |
| Median | $59,082 | $48,791 |
| Interquartile 25% (IQ1) | $54,739 | $43,424 |
| Interquartile 75% (IQ3) | $63,324 | $54,664 |
| Interquartile Range (IQR) | $8,585 | $11,240 |
| Standard Deviation (Sample) | $13,387 | $9,769 |
| Standard Deviation (Population) | $13,064 | $9,663 |
Similar Demographics by Householder Income Under 25 years
Demographics Similar to Guamanians/Chamorros by Householder Income Under 25 years
In terms of householder income under 25 years, the demographic groups most similar to Guamanians/Chamorros are Italian ($53,426, a difference of 0.010%), Immigrants from Canada ($53,411, a difference of 0.020%), Immigrants from Ethiopia ($53,408, a difference of 0.030%), Immigrants from Iraq ($53,384, a difference of 0.070%), and Colombian ($53,357, a difference of 0.12%).
| Demographics | Rating | Rank | Householder Income Under 25 years |
| Romanians | 97.2 /100 | #113 | Exceptional $53,632 |
| Immigrants | Sweden | 97.1 /100 | #114 | Exceptional $53,621 |
| Immigrants | Albania | 96.9 /100 | #115 | Exceptional $53,597 |
| Immigrants | Spain | 96.6 /100 | #116 | Exceptional $53,560 |
| Lithuanians | 96.6 /100 | #117 | Exceptional $53,552 |
| Immigrants | Switzerland | 96.3 /100 | #118 | Exceptional $53,528 |
| Italians | 95.4 /100 | #119 | Exceptional $53,426 |
| Guamanians/Chamorros | 95.3 /100 | #120 | Exceptional $53,423 |
| Immigrants | Canada | 95.2 /100 | #121 | Exceptional $53,411 |
| Immigrants | Ethiopia | 95.2 /100 | #122 | Exceptional $53,408 |
| Immigrants | Iraq | 94.9 /100 | #123 | Exceptional $53,384 |
| Colombians | 94.6 /100 | #124 | Exceptional $53,357 |
| Pakistanis | 94.1 /100 | #125 | Exceptional $53,325 |
| Immigrants | Serbia | 94.1 /100 | #126 | Exceptional $53,321 |
| Immigrants | North America | 93.9 /100 | #127 | Exceptional $53,307 |
Demographics Similar to Malaysians by Householder Income Under 25 years
In terms of householder income under 25 years, the demographic groups most similar to Malaysians are Panamanian ($51,611, a difference of 0.010%), West Indian ($51,583, a difference of 0.060%), Immigrants from Eritrea ($51,574, a difference of 0.080%), Croatian ($51,662, a difference of 0.090%), and Northern European ($51,678, a difference of 0.12%).
| Demographics | Rating | Rank | Householder Income Under 25 years |
| Mexican American Indians | 27.0 /100 | #183 | Fair $51,783 |
| Paiute | 25.1 /100 | #184 | Fair $51,743 |
| Immigrants | Latvia | 24.8 /100 | #185 | Fair $51,737 |
| Alaskan Athabascans | 23.8 /100 | #186 | Fair $51,713 |
| Immigrants | South Africa | 23.4 /100 | #187 | Fair $51,705 |
| Northern Europeans | 22.2 /100 | #188 | Fair $51,678 |
| Croatians | 21.6 /100 | #189 | Fair $51,662 |
| Malaysians | 19.7 /100 | #190 | Poor $51,615 |
| Panamanians | 19.5 /100 | #191 | Poor $51,611 |
| West Indians | 18.5 /100 | #192 | Poor $51,583 |
| Immigrants | Eritrea | 18.1 /100 | #193 | Poor $51,574 |
| Guatemalans | 16.4 /100 | #194 | Poor $51,525 |
| Estonians | 16.4 /100 | #195 | Poor $51,523 |
| Palestinians | 16.1 /100 | #196 | Poor $51,515 |
| Pima | 15.7 /100 | #197 | Poor $51,503 |