Cypriot vs Jordanian Householder Income Under 25 years
COMPARE
Cypriot
Jordanian
Householder Income Under 25 years
Householder Income Under 25 years Comparison
Cypriots
Jordanians
$52,209
HOUSEHOLDER INCOME UNDER 25 YEARS
51.2/ 100
METRIC RATING
172nd/ 347
METRIC RANK
$51,796
HOUSEHOLDER INCOME UNDER 25 YEARS
27.6/ 100
METRIC RATING
182nd/ 347
METRIC RANK
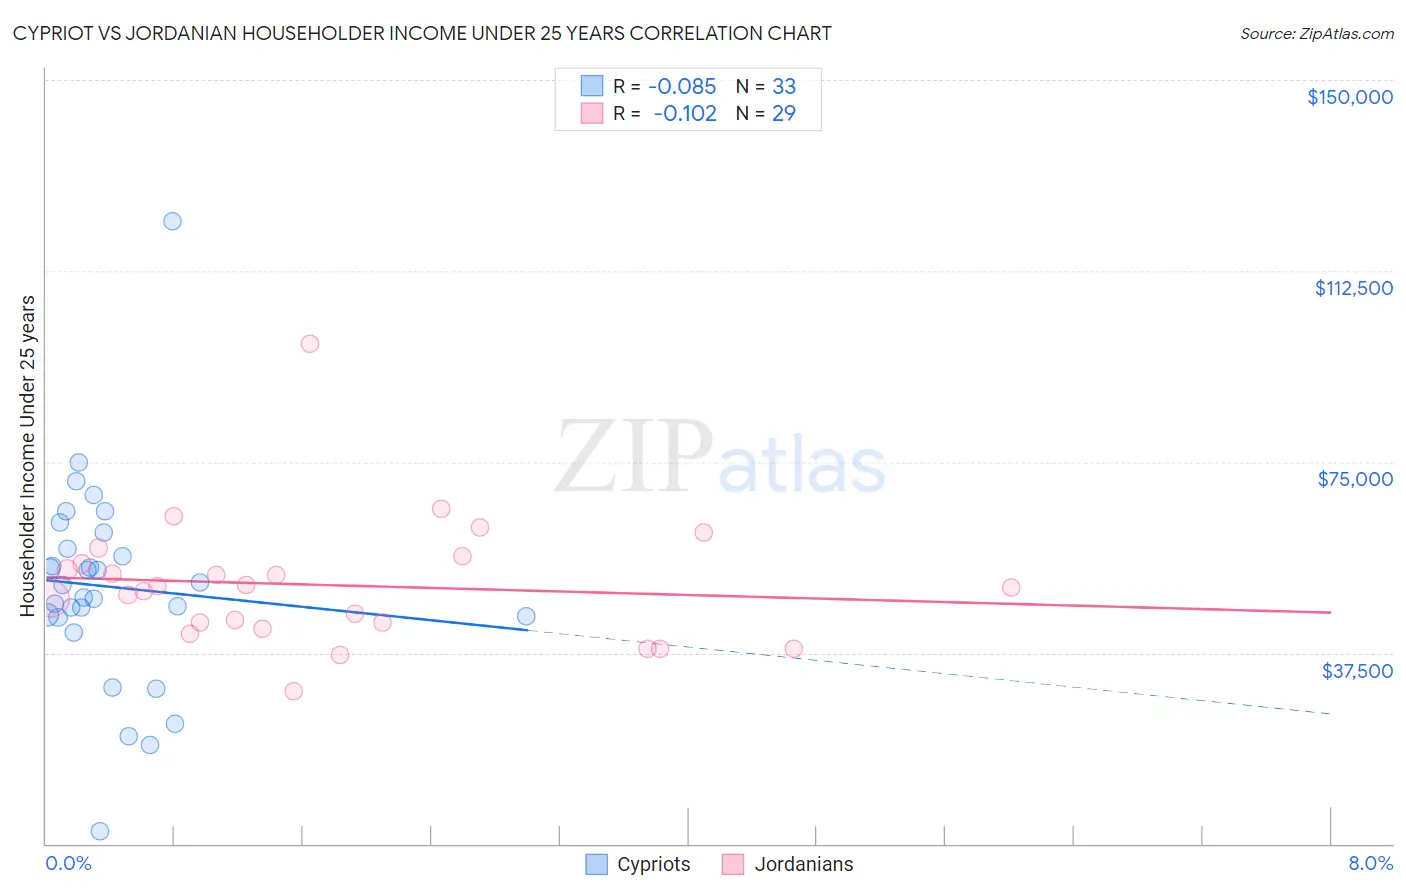
Cypriot vs Jordanian Householder Income Under 25 years Correlation Chart
The statistical analysis conducted on geographies consisting of 57,005,304 people shows a slight negative correlation between the proportion of Cypriots and household income with householder under the age of 25 in the United States with a correlation coefficient (R) of -0.085 and weighted average of $52,209. Similarly, the statistical analysis conducted on geographies consisting of 151,351,100 people shows a poor negative correlation between the proportion of Jordanians and household income with householder under the age of 25 in the United States with a correlation coefficient (R) of -0.102 and weighted average of $51,796, a difference of 0.80%.
Householder Income Under 25 years Correlation Summary
| Measurement | Cypriot | Jordanian |
| Minimum | $2,499 | $29,848 |
| Maximum | $122,212 | $98,216 |
| Range | $119,713 | $68,368 |
| Mean | $50,436 | $50,808 |
| Median | $50,796 | $50,313 |
| Interquartile 25% (IQ1) | $44,534 | $42,854 |
| Interquartile 75% (IQ3) | $59,526 | $55,629 |
| Interquartile Range (IQR) | $14,992 | $12,776 |
| Standard Deviation (Sample) | $20,344 | $12,639 |
| Standard Deviation (Population) | $20,033 | $12,419 |
Demographics Similar to Cypriots and Jordanians by Householder Income Under 25 years
In terms of householder income under 25 years, the demographic groups most similar to Cypriots are Barbadian ($52,202, a difference of 0.010%), Immigrants from Western Asia ($52,190, a difference of 0.040%), Immigrants from Uruguay ($52,302, a difference of 0.18%), Canadian ($52,336, a difference of 0.24%), and Israeli ($52,335, a difference of 0.24%). Similarly, the demographic groups most similar to Jordanians are European ($51,796, a difference of 0.0%), Mexican American Indian ($51,783, a difference of 0.030%), Basque ($51,818, a difference of 0.040%), Immigrants from England ($51,817, a difference of 0.040%), and Finnish ($51,827, a difference of 0.060%).
| Demographics | Rating | Rank | Householder Income Under 25 years |
| Immigrants | Uganda | 61.1 /100 | #167 | Good $52,374 |
| Japanese | 60.5 /100 | #168 | Good $52,365 |
| Canadians | 58.8 /100 | #169 | Average $52,336 |
| Israelis | 58.8 /100 | #170 | Average $52,335 |
| Immigrants | Uruguay | 56.8 /100 | #171 | Average $52,302 |
| Cypriots | 51.2 /100 | #172 | Average $52,209 |
| Barbadians | 50.8 /100 | #173 | Average $52,202 |
| Immigrants | Western Asia | 50.0 /100 | #174 | Average $52,190 |
| Immigrants | Zimbabwe | 33.8 /100 | #175 | Fair $51,914 |
| Austrians | 32.9 /100 | #176 | Fair $51,898 |
| British West Indians | 30.0 /100 | #177 | Fair $51,844 |
| Finns | 29.2 /100 | #178 | Fair $51,827 |
| Basques | 28.7 /100 | #179 | Fair $51,818 |
| Immigrants | England | 28.7 /100 | #180 | Fair $51,817 |
| Europeans | 27.6 /100 | #181 | Fair $51,796 |
| Jordanians | 27.6 /100 | #182 | Fair $51,796 |
| Mexican American Indians | 27.0 /100 | #183 | Fair $51,783 |
| Paiute | 25.1 /100 | #184 | Fair $51,743 |
| Immigrants | Latvia | 24.8 /100 | #185 | Fair $51,737 |
| Alaskan Athabascans | 23.8 /100 | #186 | Fair $51,713 |
| Immigrants | South Africa | 23.4 /100 | #187 | Fair $51,705 |