Scotch-Irish vs Immigrants from Lebanon Unemployment Among Ages 60 to 64 years
COMPARE
Scotch-Irish
Immigrants from Lebanon
Unemployment Among Ages 60 to 64 years
Unemployment Among Ages 60 to 64 years Comparison
Scotch-Irish
Immigrants from Lebanon
4.6%
UNEMPLOYMENT AMONG AGES 60 TO 64 YEARS
99.9/ 100
METRIC RATING
49th/ 347
METRIC RANK
4.8%
UNEMPLOYMENT AMONG AGES 60 TO 64 YEARS
89.6/ 100
METRIC RATING
131st/ 347
METRIC RANK
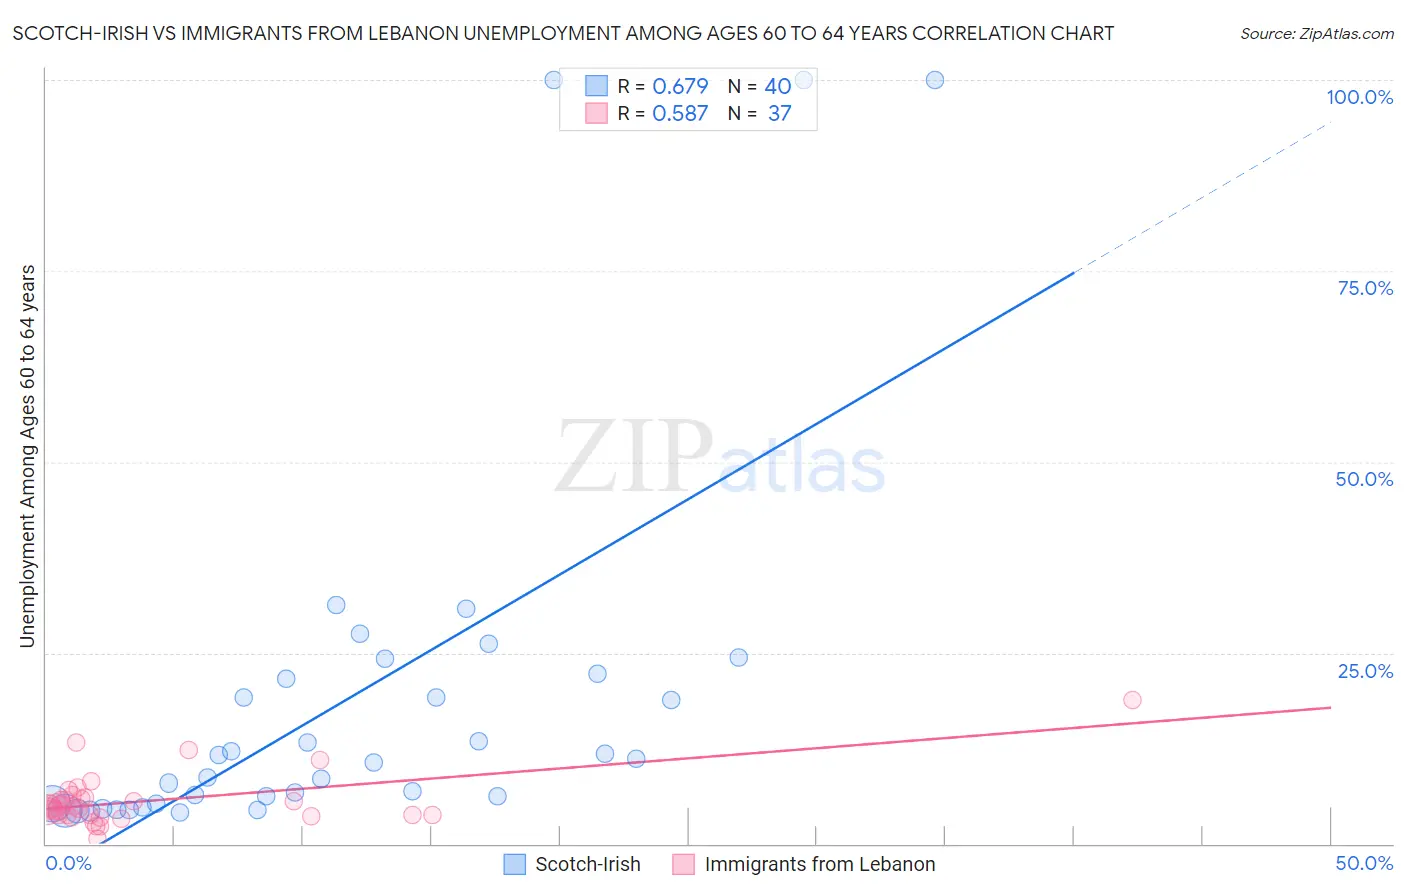
Scotch-Irish vs Immigrants from Lebanon Unemployment Among Ages 60 to 64 years Correlation Chart
The statistical analysis conducted on geographies consisting of 450,645,011 people shows a significant positive correlation between the proportion of Scotch-Irish and unemployment rate among population between the ages 60 and 64 in the United States with a correlation coefficient (R) of 0.679 and weighted average of 4.6%. Similarly, the statistical analysis conducted on geographies consisting of 207,036,790 people shows a substantial positive correlation between the proportion of Immigrants from Lebanon and unemployment rate among population between the ages 60 and 64 in the United States with a correlation coefficient (R) of 0.587 and weighted average of 4.8%, a difference of 4.5%.
Unemployment Among Ages 60 to 64 years Correlation Summary
| Measurement | Scotch-Irish | Immigrants from Lebanon |
| Minimum | 4.0% | 0.60% |
| Maximum | 100.0% | 18.9% |
| Range | 96.0% | 18.3% |
| Mean | 18.9% | 5.6% |
| Median | 10.9% | 4.7% |
| Interquartile 25% (IQ1) | 5.3% | 3.7% |
| Interquartile 75% (IQ3) | 21.9% | 6.0% |
| Interquartile Range (IQR) | 16.6% | 2.3% |
| Standard Deviation (Sample) | 24.8% | 3.4% |
| Standard Deviation (Population) | 24.5% | 3.4% |
Similar Demographics by Unemployment Among Ages 60 to 64 years
Demographics Similar to Scotch-Irish by Unemployment Among Ages 60 to 64 years
In terms of unemployment among ages 60 to 64 years, the demographic groups most similar to Scotch-Irish are Scottish (4.6%, a difference of 0.030%), Immigrants from Zimbabwe (4.6%, a difference of 0.050%), Immigrants from Kenya (4.6%, a difference of 0.15%), Kenyan (4.6%, a difference of 0.16%), and Immigrants from Moldova (4.6%, a difference of 0.26%).
| Demographics | Rating | Rank | Unemployment Among Ages 60 to 64 years |
| English | 100.0 /100 | #42 | Exceptional 4.5% |
| Swedes | 100.0 /100 | #43 | Exceptional 4.5% |
| Europeans | 100.0 /100 | #44 | Exceptional 4.5% |
| Liberians | 99.9 /100 | #45 | Exceptional 4.5% |
| Bhutanese | 99.9 /100 | #46 | Exceptional 4.5% |
| Assyrians/Chaldeans/Syriacs | 99.9 /100 | #47 | Exceptional 4.5% |
| Immigrants | Zimbabwe | 99.9 /100 | #48 | Exceptional 4.6% |
| Scotch-Irish | 99.9 /100 | #49 | Exceptional 4.6% |
| Scottish | 99.9 /100 | #50 | Exceptional 4.6% |
| Immigrants | Kenya | 99.9 /100 | #51 | Exceptional 4.6% |
| Kenyans | 99.9 /100 | #52 | Exceptional 4.6% |
| Immigrants | Moldova | 99.9 /100 | #53 | Exceptional 4.6% |
| Dutch | 99.9 /100 | #54 | Exceptional 4.6% |
| Bangladeshis | 99.9 /100 | #55 | Exceptional 4.6% |
| Welsh | 99.9 /100 | #56 | Exceptional 4.6% |
Demographics Similar to Immigrants from Lebanon by Unemployment Among Ages 60 to 64 years
In terms of unemployment among ages 60 to 64 years, the demographic groups most similar to Immigrants from Lebanon are Lithuanian (4.8%, a difference of 0.0%), Yaqui (4.8%, a difference of 0.010%), Immigrants from Syria (4.8%, a difference of 0.050%), Immigrants from Serbia (4.8%, a difference of 0.060%), and Choctaw (4.8%, a difference of 0.070%).
| Demographics | Rating | Rank | Unemployment Among Ages 60 to 64 years |
| Immigrants | Senegal | 94.5 /100 | #124 | Exceptional 4.7% |
| Immigrants | Thailand | 93.7 /100 | #125 | Exceptional 4.7% |
| Immigrants | South Central Asia | 93.0 /100 | #126 | Exceptional 4.7% |
| Austrians | 91.9 /100 | #127 | Exceptional 4.8% |
| Choctaw | 90.3 /100 | #128 | Exceptional 4.8% |
| Immigrants | Serbia | 90.2 /100 | #129 | Exceptional 4.8% |
| Immigrants | Syria | 90.1 /100 | #130 | Exceptional 4.8% |
| Immigrants | Lebanon | 89.6 /100 | #131 | Excellent 4.8% |
| Lithuanians | 89.6 /100 | #132 | Excellent 4.8% |
| Yaqui | 89.5 /100 | #133 | Excellent 4.8% |
| Basques | 88.8 /100 | #134 | Excellent 4.8% |
| Pennsylvania Germans | 87.8 /100 | #135 | Excellent 4.8% |
| French Canadians | 87.6 /100 | #136 | Excellent 4.8% |
| Cambodians | 86.9 /100 | #137 | Excellent 4.8% |
| Immigrants | Lithuania | 86.7 /100 | #138 | Excellent 4.8% |