Scotch-Irish vs Immigrants from El Salvador Median Household Income
COMPARE
Scotch-Irish
Immigrants from El Salvador
Median Household Income
Median Household Income Comparison
Scotch-Irish
Immigrants from El Salvador
$80,972
MEDIAN HOUSEHOLD INCOME
6.6/ 100
METRIC RATING
225th/ 347
METRIC RANK
$81,213
MEDIAN HOUSEHOLD INCOME
7.6/ 100
METRIC RATING
223rd/ 347
METRIC RANK
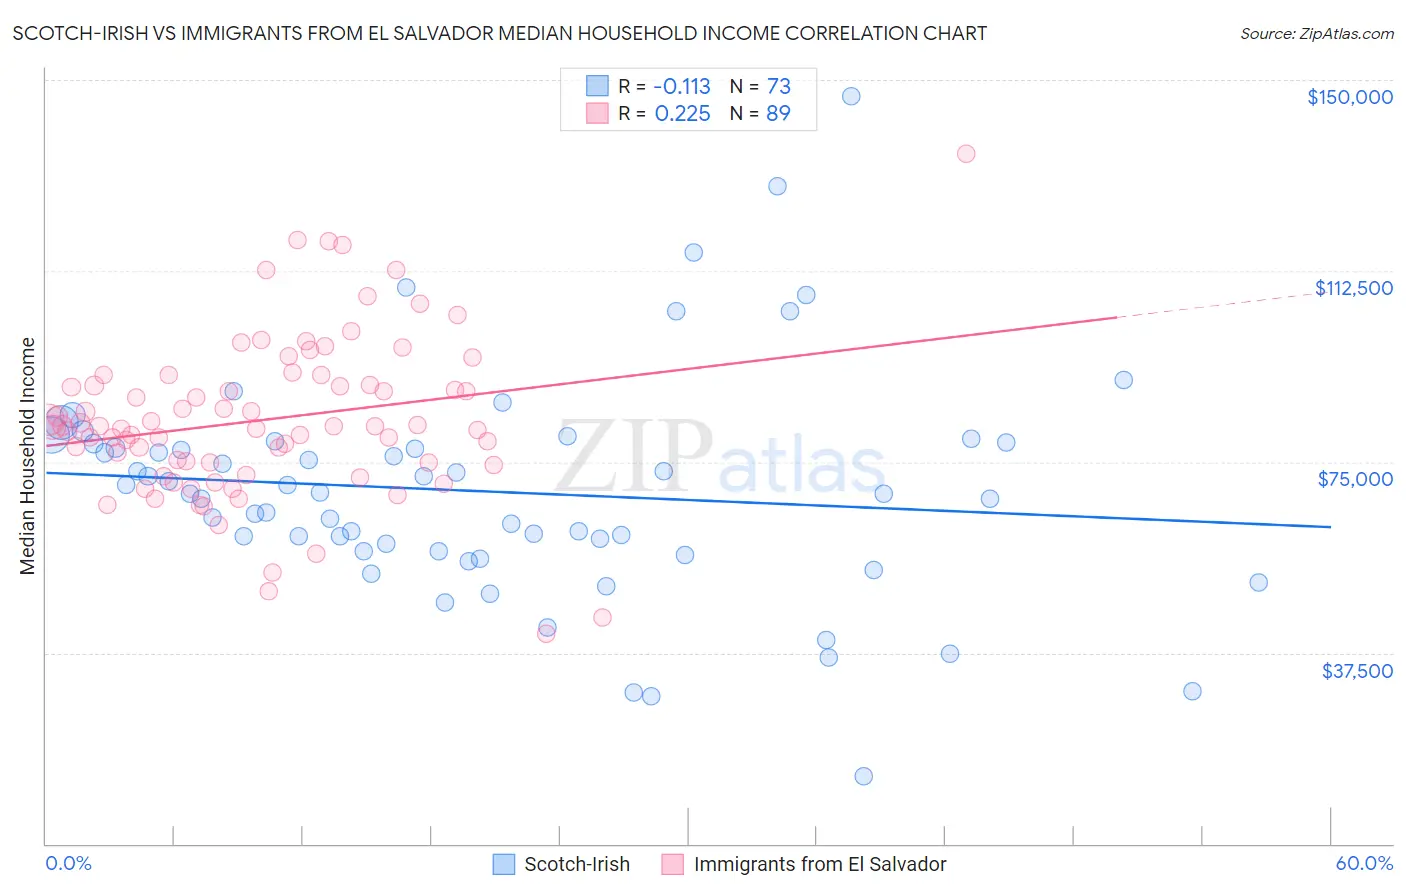
Scotch-Irish vs Immigrants from El Salvador Median Household Income Correlation Chart
The statistical analysis conducted on geographies consisting of 548,026,119 people shows a poor negative correlation between the proportion of Scotch-Irish and median household income in the United States with a correlation coefficient (R) of -0.113 and weighted average of $80,972. Similarly, the statistical analysis conducted on geographies consisting of 357,662,505 people shows a weak positive correlation between the proportion of Immigrants from El Salvador and median household income in the United States with a correlation coefficient (R) of 0.225 and weighted average of $81,213, a difference of 0.30%.
Median Household Income Correlation Summary
| Measurement | Scotch-Irish | Immigrants from El Salvador |
| Minimum | $13,333 | $41,123 |
| Maximum | $146,875 | $135,638 |
| Range | $133,542 | $94,515 |
| Mean | $69,187 | $83,315 |
| Median | $68,778 | $81,957 |
| Interquartile 25% (IQ1) | $57,401 | $74,629 |
| Interquartile 75% (IQ3) | $78,673 | $91,081 |
| Interquartile Range (IQR) | $21,272 | $16,452 |
| Standard Deviation (Sample) | $22,180 | $15,893 |
| Standard Deviation (Population) | $22,027 | $15,803 |
Demographics Similar to Scotch-Irish and Immigrants from El Salvador by Median Household Income
In terms of median household income, the demographic groups most similar to Scotch-Irish are Malaysian ($81,064, a difference of 0.11%), Immigrants from Panama ($80,873, a difference of 0.12%), Guyanese ($80,734, a difference of 0.29%), Immigrants from Bangladesh ($80,722, a difference of 0.31%), and Immigrants from Nigeria ($81,236, a difference of 0.33%). Similarly, the demographic groups most similar to Immigrants from El Salvador are Immigrants from Nigeria ($81,236, a difference of 0.030%), Malaysian ($81,064, a difference of 0.18%), Immigrants from Ghana ($81,489, a difference of 0.34%), Immigrants from Venezuela ($81,506, a difference of 0.36%), and Immigrants from Panama ($80,873, a difference of 0.42%).
| Demographics | Rating | Rank | Median Household Income |
| Panamanians | 14.0 /100 | #214 | Poor $82,272 |
| Vietnamese | 13.8 /100 | #215 | Poor $82,248 |
| Yugoslavians | 13.3 /100 | #216 | Poor $82,186 |
| Ecuadorians | 12.5 /100 | #217 | Poor $82,070 |
| Whites/Caucasians | 12.2 /100 | #218 | Poor $82,029 |
| Nigerians | 10.3 /100 | #219 | Poor $81,725 |
| Immigrants | Venezuela | 9.0 /100 | #220 | Tragic $81,506 |
| Immigrants | Ghana | 9.0 /100 | #221 | Tragic $81,489 |
| Immigrants | Nigeria | 7.7 /100 | #222 | Tragic $81,236 |
| Immigrants | El Salvador | 7.6 /100 | #223 | Tragic $81,213 |
| Malaysians | 7.0 /100 | #224 | Tragic $81,064 |
| Scotch-Irish | 6.6 /100 | #225 | Tragic $80,972 |
| Immigrants | Panama | 6.2 /100 | #226 | Tragic $80,873 |
| Guyanese | 5.7 /100 | #227 | Tragic $80,734 |
| Immigrants | Bangladesh | 5.7 /100 | #228 | Tragic $80,722 |
| Delaware | 5.0 /100 | #229 | Tragic $80,527 |
| Bermudans | 4.7 /100 | #230 | Tragic $80,406 |
| Trinidadians and Tobagonians | 4.7 /100 | #231 | Tragic $80,402 |
| Immigrants | Trinidad and Tobago | 4.6 /100 | #232 | Tragic $80,373 |
| Immigrants | Azores | 4.5 /100 | #233 | Tragic $80,357 |
| Immigrants | Ecuador | 4.5 /100 | #234 | Tragic $80,341 |