Afghan vs Filipino Median Household Income
COMPARE
Afghan
Filipino
Median Household Income
Median Household Income Comparison
Afghans
Filipinos
$97,026
MEDIAN HOUSEHOLD INCOME
100.0/ 100
METRIC RATING
39th/ 347
METRIC RANK
$115,509
MEDIAN HOUSEHOLD INCOME
100.0/ 100
METRIC RATING
2nd/ 347
METRIC RANK
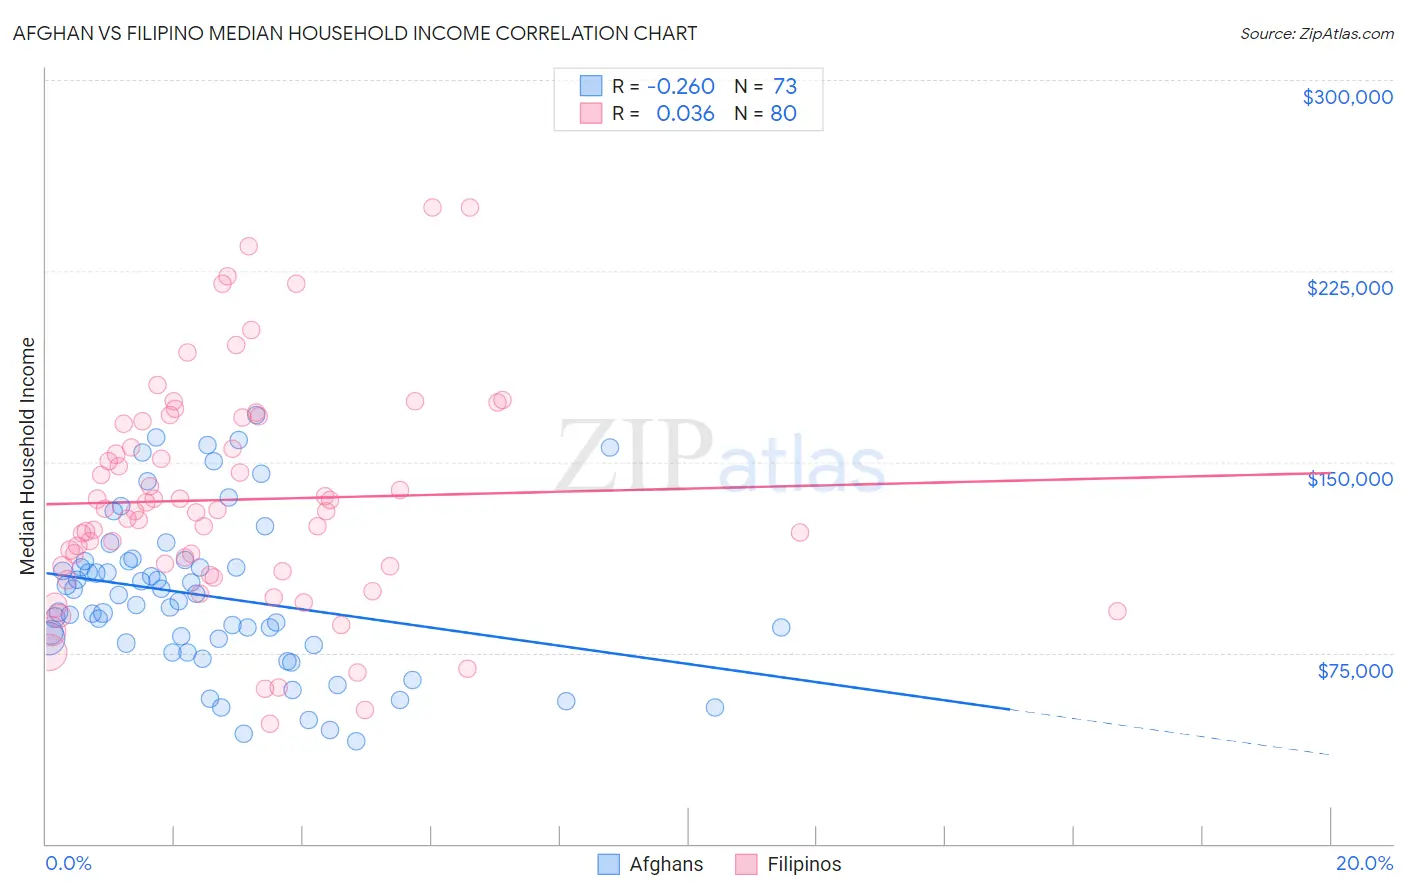
Afghan vs Filipino Median Household Income Correlation Chart
The statistical analysis conducted on geographies consisting of 148,820,759 people shows a weak negative correlation between the proportion of Afghans and median household income in the United States with a correlation coefficient (R) of -0.260 and weighted average of $97,026. Similarly, the statistical analysis conducted on geographies consisting of 254,115,678 people shows no correlation between the proportion of Filipinos and median household income in the United States with a correlation coefficient (R) of 0.036 and weighted average of $115,509, a difference of 19.1%.
Median Household Income Correlation Summary
| Measurement | Afghan | Filipino |
| Minimum | $40,069 | $47,188 |
| Maximum | $168,646 | $250,001 |
| Range | $128,577 | $202,813 |
| Mean | $97,284 | $135,113 |
| Median | $95,399 | $130,633 |
| Interquartile 25% (IQ1) | $78,550 | $107,886 |
| Interquartile 75% (IQ3) | $110,861 | $165,301 |
| Interquartile Range (IQR) | $32,311 | $57,415 |
| Standard Deviation (Sample) | $30,429 | $43,772 |
| Standard Deviation (Population) | $30,220 | $43,498 |
Similar Demographics by Median Household Income
Demographics Similar to Afghans by Median Household Income
In terms of median household income, the demographic groups most similar to Afghans are Maltese ($97,015, a difference of 0.010%), Immigrants from Turkey ($96,964, a difference of 0.060%), Immigrants from Lithuania ($96,836, a difference of 0.20%), Immigrants from Indonesia ($97,297, a difference of 0.28%), and Latvian ($97,311, a difference of 0.29%).
| Demographics | Rating | Rank | Median Household Income |
| Immigrants | Denmark | 100.0 /100 | #32 | Exceptional $98,510 |
| Chinese | 100.0 /100 | #33 | Exceptional $98,496 |
| Russians | 100.0 /100 | #34 | Exceptional $98,008 |
| Immigrants | Switzerland | 100.0 /100 | #35 | Exceptional $97,979 |
| Immigrants | Pakistan | 100.0 /100 | #36 | Exceptional $97,528 |
| Latvians | 100.0 /100 | #37 | Exceptional $97,311 |
| Immigrants | Indonesia | 100.0 /100 | #38 | Exceptional $97,297 |
| Afghans | 100.0 /100 | #39 | Exceptional $97,026 |
| Maltese | 100.0 /100 | #40 | Exceptional $97,015 |
| Immigrants | Turkey | 100.0 /100 | #41 | Exceptional $96,964 |
| Immigrants | Lithuania | 99.9 /100 | #42 | Exceptional $96,836 |
| Immigrants | France | 99.9 /100 | #43 | Exceptional $96,743 |
| Immigrants | Greece | 99.9 /100 | #44 | Exceptional $96,675 |
| Israelis | 99.9 /100 | #45 | Exceptional $96,552 |
| Australians | 99.9 /100 | #46 | Exceptional $96,490 |
Demographics Similar to Filipinos by Median Household Income
In terms of median household income, the demographic groups most similar to Filipinos are Immigrants from Taiwan ($116,460, a difference of 0.82%), Immigrants from India ($113,009, a difference of 2.2%), Immigrants from Hong Kong ($111,519, a difference of 3.6%), Thai ($110,648, a difference of 4.4%), and Immigrants from Singapore ($110,428, a difference of 4.6%).
| Demographics | Rating | Rank | Median Household Income |
| Immigrants | Taiwan | 100.0 /100 | #1 | Exceptional $116,460 |
| Filipinos | 100.0 /100 | #2 | Exceptional $115,509 |
| Immigrants | India | 100.0 /100 | #3 | Exceptional $113,009 |
| Immigrants | Hong Kong | 100.0 /100 | #4 | Exceptional $111,519 |
| Thais | 100.0 /100 | #5 | Exceptional $110,648 |
| Immigrants | Singapore | 100.0 /100 | #6 | Exceptional $110,428 |
| Iranians | 100.0 /100 | #7 | Exceptional $109,835 |
| Immigrants | Iran | 100.0 /100 | #8 | Exceptional $108,055 |
| Okinawans | 100.0 /100 | #9 | Exceptional $106,624 |
| Immigrants | South Central Asia | 100.0 /100 | #10 | Exceptional $106,057 |
| Immigrants | China | 100.0 /100 | #11 | Exceptional $105,335 |
| Indians (Asian) | 100.0 /100 | #12 | Exceptional $105,262 |
| Immigrants | Eastern Asia | 100.0 /100 | #13 | Exceptional $104,796 |
| Immigrants | Ireland | 100.0 /100 | #14 | Exceptional $104,692 |
| Immigrants | Israel | 100.0 /100 | #15 | Exceptional $104,090 |