Portuguese vs Potawatomi Median Male Earnings
COMPARE
Portuguese
Potawatomi
Median Male Earnings
Median Male Earnings Comparison
Portuguese
Potawatomi
$56,663
MEDIAN MALE EARNINGS
89.4/ 100
METRIC RATING
131st/ 347
METRIC RANK
$48,768
MEDIAN MALE EARNINGS
0.4/ 100
METRIC RATING
270th/ 347
METRIC RANK
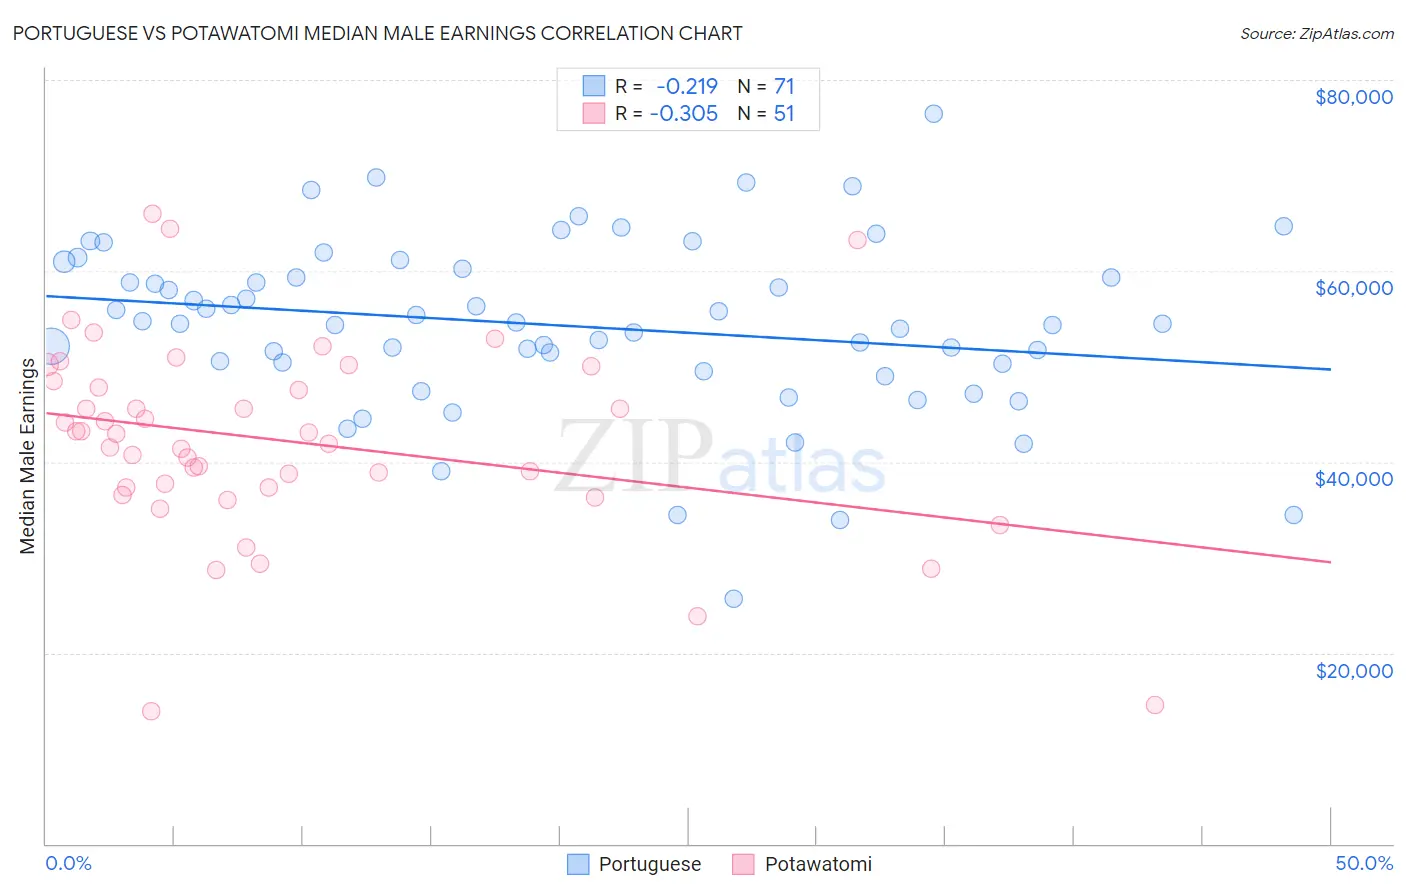
Portuguese vs Potawatomi Median Male Earnings Correlation Chart
The statistical analysis conducted on geographies consisting of 450,078,327 people shows a weak negative correlation between the proportion of Portuguese and median male earnings in the United States with a correlation coefficient (R) of -0.219 and weighted average of $56,663. Similarly, the statistical analysis conducted on geographies consisting of 117,758,062 people shows a mild negative correlation between the proportion of Potawatomi and median male earnings in the United States with a correlation coefficient (R) of -0.305 and weighted average of $48,768, a difference of 16.2%.
Median Male Earnings Correlation Summary
| Measurement | Portuguese | Potawatomi |
| Minimum | $25,598 | $13,889 |
| Maximum | $76,528 | $66,032 |
| Range | $50,930 | $52,143 |
| Mean | $54,293 | $42,177 |
| Median | $54,519 | $42,915 |
| Interquartile 25% (IQ1) | $50,262 | $37,274 |
| Interquartile 75% (IQ3) | $60,181 | $48,416 |
| Interquartile Range (IQR) | $9,919 | $11,141 |
| Standard Deviation (Sample) | $9,132 | $10,408 |
| Standard Deviation (Population) | $9,067 | $10,305 |
Similar Demographics by Median Male Earnings
Demographics Similar to Portuguese by Median Male Earnings
In terms of median male earnings, the demographic groups most similar to Portuguese are Korean ($56,672, a difference of 0.020%), Pakistani ($56,719, a difference of 0.10%), Czech ($56,546, a difference of 0.21%), Immigrants from Germany ($56,542, a difference of 0.21%), and Immigrants from Syria ($56,830, a difference of 0.29%).
| Demographics | Rating | Rank | Median Male Earnings |
| Chileans | 91.9 /100 | #124 | Exceptional $56,973 |
| Immigrants | Morocco | 91.8 /100 | #125 | Exceptional $56,958 |
| Chinese | 91.1 /100 | #126 | Exceptional $56,872 |
| Brazilians | 90.9 /100 | #127 | Exceptional $56,837 |
| Immigrants | Syria | 90.8 /100 | #128 | Exceptional $56,830 |
| Pakistanis | 89.9 /100 | #129 | Excellent $56,719 |
| Koreans | 89.4 /100 | #130 | Excellent $56,672 |
| Portuguese | 89.4 /100 | #131 | Excellent $56,663 |
| Czechs | 88.2 /100 | #132 | Excellent $56,546 |
| Immigrants | Germany | 88.2 /100 | #133 | Excellent $56,542 |
| Moroccans | 87.7 /100 | #134 | Excellent $56,499 |
| Irish | 87.4 /100 | #135 | Excellent $56,464 |
| Immigrants | Saudi Arabia | 87.2 /100 | #136 | Excellent $56,452 |
| Slavs | 86.5 /100 | #137 | Excellent $56,390 |
| Slovaks | 85.5 /100 | #138 | Excellent $56,306 |
Demographics Similar to Potawatomi by Median Male Earnings
In terms of median male earnings, the demographic groups most similar to Potawatomi are Tsimshian ($48,836, a difference of 0.14%), Cherokee ($48,669, a difference of 0.20%), Salvadoran ($48,646, a difference of 0.25%), Ute ($48,899, a difference of 0.27%), and Jamaican ($48,632, a difference of 0.28%).
| Demographics | Rating | Rank | Median Male Earnings |
| Nicaraguans | 0.6 /100 | #263 | Tragic $49,215 |
| Immigrants | Middle Africa | 0.6 /100 | #264 | Tragic $49,201 |
| Immigrants | Laos | 0.6 /100 | #265 | Tragic $49,190 |
| Somalis | 0.5 /100 | #266 | Tragic $49,025 |
| Spanish Americans | 0.5 /100 | #267 | Tragic $49,008 |
| Ute | 0.4 /100 | #268 | Tragic $48,899 |
| Tsimshian | 0.4 /100 | #269 | Tragic $48,836 |
| Potawatomi | 0.4 /100 | #270 | Tragic $48,768 |
| Cherokee | 0.3 /100 | #271 | Tragic $48,669 |
| Salvadorans | 0.3 /100 | #272 | Tragic $48,646 |
| Jamaicans | 0.3 /100 | #273 | Tragic $48,632 |
| Colville | 0.3 /100 | #274 | Tragic $48,516 |
| Immigrants | Somalia | 0.3 /100 | #275 | Tragic $48,439 |
| Blackfeet | 0.3 /100 | #276 | Tragic $48,402 |
| Belizeans | 0.2 /100 | #277 | Tragic $48,358 |