Scandinavian vs Potawatomi Unemployment Among Women with Children Under 6 years
COMPARE
Scandinavian
Potawatomi
Unemployment Among Women with Children Under 6 years
Unemployment Among Women with Children Under 6 years Comparison
Scandinavians
Potawatomi
7.4%
UNEMPLOYMENT AMONG WOMEN WITH CHILDREN UNDER 6 YEARS
83.0/ 100
METRIC RATING
140th/ 347
METRIC RANK
9.6%
UNEMPLOYMENT AMONG WOMEN WITH CHILDREN UNDER 6 YEARS
0.0/ 100
METRIC RATING
320th/ 347
METRIC RANK
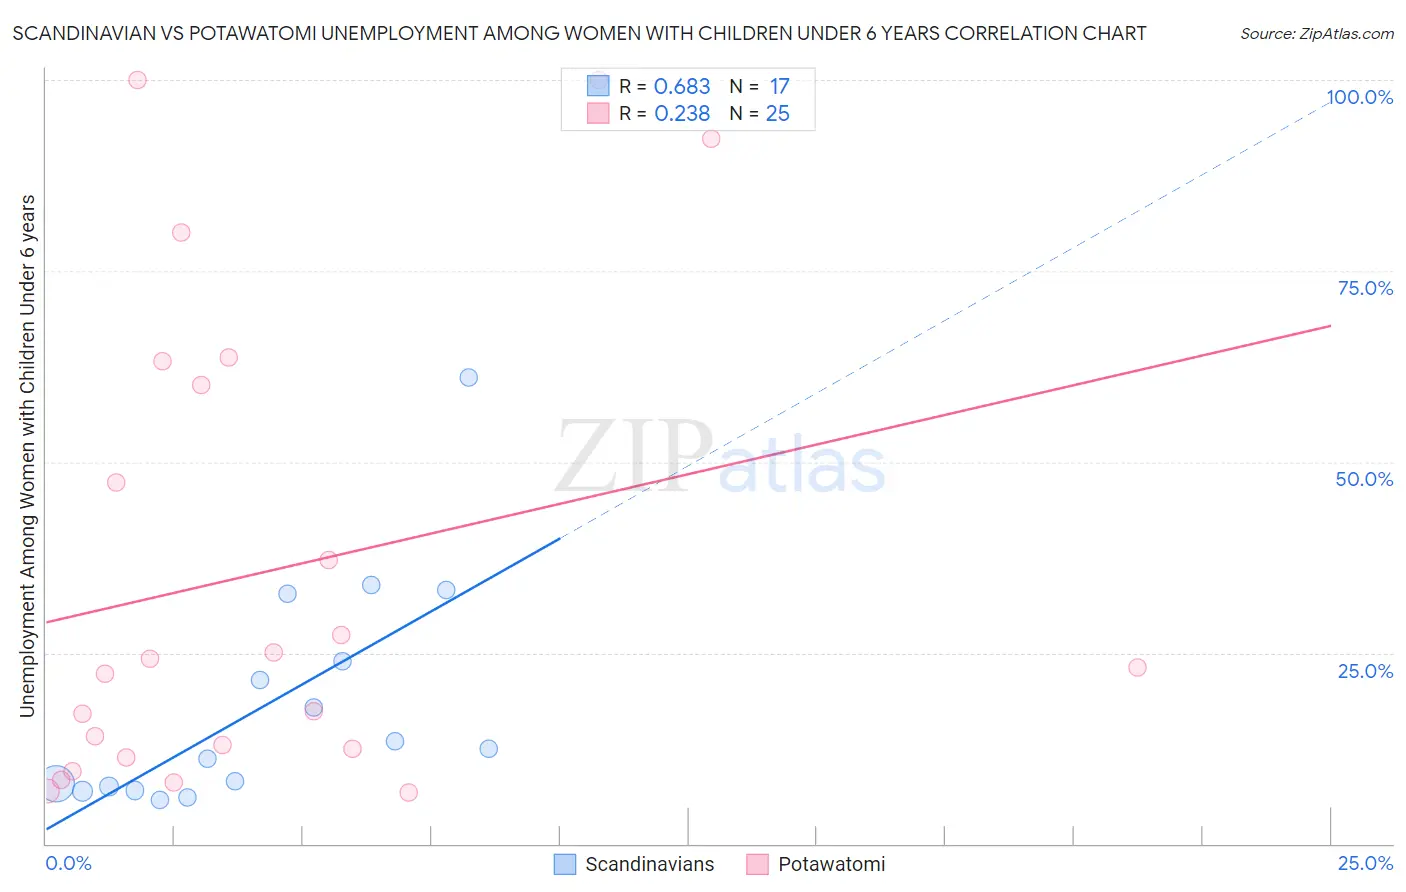
Scandinavian vs Potawatomi Unemployment Among Women with Children Under 6 years Correlation Chart
The statistical analysis conducted on geographies consisting of 330,455,497 people shows a significant positive correlation between the proportion of Scandinavians and unemployment rate among women with children under the age of 6 in the United States with a correlation coefficient (R) of 0.683 and weighted average of 7.4%. Similarly, the statistical analysis conducted on geographies consisting of 103,199,576 people shows a weak positive correlation between the proportion of Potawatomi and unemployment rate among women with children under the age of 6 in the United States with a correlation coefficient (R) of 0.238 and weighted average of 9.6%, a difference of 28.7%.
Unemployment Among Women with Children Under 6 years Correlation Summary
| Measurement | Scandinavian | Potawatomi |
| Minimum | 5.8% | 6.7% |
| Maximum | 61.1% | 100.0% |
| Range | 55.3% | 93.3% |
| Mean | 18.3% | 35.6% |
| Median | 12.5% | 23.1% |
| Interquartile 25% (IQ1) | 7.2% | 11.9% |
| Interquartile 75% (IQ3) | 28.4% | 61.6% |
| Interquartile Range (IQR) | 21.1% | 49.7% |
| Standard Deviation (Sample) | 14.9% | 31.0% |
| Standard Deviation (Population) | 14.5% | 30.4% |
Similar Demographics by Unemployment Among Women with Children Under 6 years
Demographics Similar to Scandinavians by Unemployment Among Women with Children Under 6 years
In terms of unemployment among women with children under 6 years, the demographic groups most similar to Scandinavians are Greek (7.4%, a difference of 0.060%), Immigrants from Colombia (7.4%, a difference of 0.11%), Immigrants from Norway (7.4%, a difference of 0.13%), Immigrants from Argentina (7.5%, a difference of 0.18%), and Immigrants from Cambodia (7.4%, a difference of 0.20%).
| Demographics | Rating | Rank | Unemployment Among Women with Children Under 6 years |
| Immigrants | Uganda | 86.5 /100 | #133 | Excellent 7.4% |
| Immigrants | Bolivia | 85.7 /100 | #134 | Excellent 7.4% |
| Immigrants | Northern Africa | 85.3 /100 | #135 | Excellent 7.4% |
| Immigrants | Morocco | 84.9 /100 | #136 | Excellent 7.4% |
| Immigrants | Cambodia | 84.6 /100 | #137 | Excellent 7.4% |
| Immigrants | Norway | 84.1 /100 | #138 | Excellent 7.4% |
| Immigrants | Colombia | 83.9 /100 | #139 | Excellent 7.4% |
| Scandinavians | 83.0 /100 | #140 | Excellent 7.4% |
| Greeks | 82.6 /100 | #141 | Excellent 7.4% |
| Immigrants | Argentina | 81.5 /100 | #142 | Excellent 7.5% |
| Koreans | 81.3 /100 | #143 | Excellent 7.5% |
| Europeans | 79.1 /100 | #144 | Good 7.5% |
| Immigrants | Jordan | 78.9 /100 | #145 | Good 7.5% |
| Japanese | 78.9 /100 | #146 | Good 7.5% |
| Immigrants | Oceania | 78.4 /100 | #147 | Good 7.5% |
Demographics Similar to Potawatomi by Unemployment Among Women with Children Under 6 years
In terms of unemployment among women with children under 6 years, the demographic groups most similar to Potawatomi are Marshallese (9.6%, a difference of 0.050%), Central American Indian (9.6%, a difference of 0.060%), Alaska Native (9.6%, a difference of 0.31%), Immigrants from Bahamas (9.6%, a difference of 0.50%), and Osage (9.5%, a difference of 1.1%).
| Demographics | Rating | Rank | Unemployment Among Women with Children Under 6 years |
| Americans | 0.0 /100 | #313 | Tragic 9.3% |
| Fijians | 0.0 /100 | #314 | Tragic 9.3% |
| Cherokee | 0.0 /100 | #315 | Tragic 9.3% |
| Houma | 0.0 /100 | #316 | Tragic 9.4% |
| Dutch West Indians | 0.0 /100 | #317 | Tragic 9.5% |
| Osage | 0.0 /100 | #318 | Tragic 9.5% |
| Marshallese | 0.0 /100 | #319 | Tragic 9.6% |
| Potawatomi | 0.0 /100 | #320 | Tragic 9.6% |
| Central American Indians | 0.0 /100 | #321 | Tragic 9.6% |
| Alaska Natives | 0.0 /100 | #322 | Tragic 9.6% |
| Immigrants | Bahamas | 0.0 /100 | #323 | Tragic 9.6% |
| Paiute | 0.0 /100 | #324 | Tragic 9.7% |
| Choctaw | 0.0 /100 | #325 | Tragic 9.8% |
| Delaware | 0.0 /100 | #326 | Tragic 9.8% |
| Ottawa | 0.0 /100 | #327 | Tragic 9.9% |