Cherokee vs Immigrants from Czechoslovakia Median Male Earnings
COMPARE
Cherokee
Immigrants from Czechoslovakia
Median Male Earnings
Median Male Earnings Comparison
Cherokee
Immigrants from Czechoslovakia
$48,669
MEDIAN MALE EARNINGS
0.3/ 100
METRIC RATING
271st/ 347
METRIC RANK
$62,217
MEDIAN MALE EARNINGS
99.9/ 100
METRIC RATING
46th/ 347
METRIC RANK
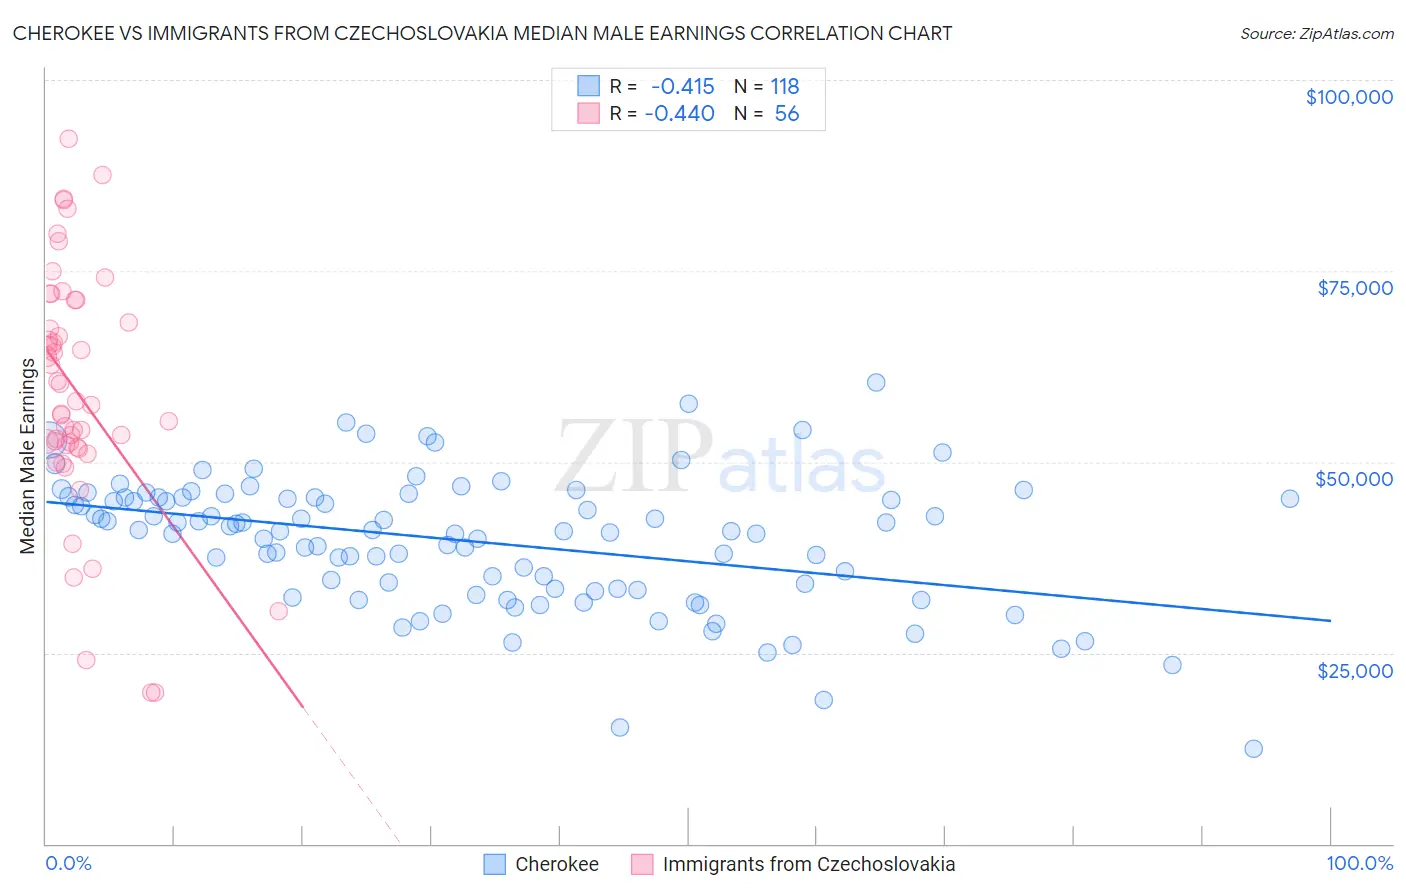
Cherokee vs Immigrants from Czechoslovakia Median Male Earnings Correlation Chart
The statistical analysis conducted on geographies consisting of 493,193,856 people shows a moderate negative correlation between the proportion of Cherokee and median male earnings in the United States with a correlation coefficient (R) of -0.415 and weighted average of $48,669. Similarly, the statistical analysis conducted on geographies consisting of 195,431,341 people shows a moderate negative correlation between the proportion of Immigrants from Czechoslovakia and median male earnings in the United States with a correlation coefficient (R) of -0.440 and weighted average of $62,217, a difference of 27.8%.
Median Male Earnings Correlation Summary
| Measurement | Cherokee | Immigrants from Czechoslovakia |
| Minimum | $12,361 | $19,792 |
| Maximum | $60,438 | $92,305 |
| Range | $48,077 | $72,513 |
| Mean | $39,586 | $59,087 |
| Median | $40,957 | $57,746 |
| Interquartile 25% (IQ1) | $33,308 | $51,971 |
| Interquartile 75% (IQ3) | $45,365 | $69,695 |
| Interquartile Range (IQR) | $12,057 | $17,724 |
| Standard Deviation (Sample) | $8,544 | $15,934 |
| Standard Deviation (Population) | $8,508 | $15,791 |
Similar Demographics by Median Male Earnings
Demographics Similar to Cherokee by Median Male Earnings
In terms of median male earnings, the demographic groups most similar to Cherokee are Salvadoran ($48,646, a difference of 0.050%), Jamaican ($48,632, a difference of 0.080%), Potawatomi ($48,768, a difference of 0.20%), Colville ($48,516, a difference of 0.32%), and Tsimshian ($48,836, a difference of 0.34%).
| Demographics | Rating | Rank | Median Male Earnings |
| Immigrants | Middle Africa | 0.6 /100 | #264 | Tragic $49,201 |
| Immigrants | Laos | 0.6 /100 | #265 | Tragic $49,190 |
| Somalis | 0.5 /100 | #266 | Tragic $49,025 |
| Spanish Americans | 0.5 /100 | #267 | Tragic $49,008 |
| Ute | 0.4 /100 | #268 | Tragic $48,899 |
| Tsimshian | 0.4 /100 | #269 | Tragic $48,836 |
| Potawatomi | 0.4 /100 | #270 | Tragic $48,768 |
| Cherokee | 0.3 /100 | #271 | Tragic $48,669 |
| Salvadorans | 0.3 /100 | #272 | Tragic $48,646 |
| Jamaicans | 0.3 /100 | #273 | Tragic $48,632 |
| Colville | 0.3 /100 | #274 | Tragic $48,516 |
| Immigrants | Somalia | 0.3 /100 | #275 | Tragic $48,439 |
| Blackfeet | 0.3 /100 | #276 | Tragic $48,402 |
| Belizeans | 0.2 /100 | #277 | Tragic $48,358 |
| Immigrants | Liberia | 0.2 /100 | #278 | Tragic $48,317 |
Demographics Similar to Immigrants from Czechoslovakia by Median Male Earnings
In terms of median male earnings, the demographic groups most similar to Immigrants from Czechoslovakia are Immigrants from Austria ($62,164, a difference of 0.090%), Immigrants from Malaysia ($62,121, a difference of 0.15%), Bulgarian ($62,378, a difference of 0.26%), Immigrants from Europe ($62,057, a difference of 0.26%), and Cambodian ($62,516, a difference of 0.48%).
| Demographics | Rating | Rank | Median Male Earnings |
| Immigrants | South Africa | 100.0 /100 | #39 | Exceptional $62,899 |
| Australians | 100.0 /100 | #40 | Exceptional $62,857 |
| Immigrants | Turkey | 100.0 /100 | #41 | Exceptional $62,728 |
| Immigrants | Greece | 100.0 /100 | #42 | Exceptional $62,689 |
| Immigrants | Belarus | 100.0 /100 | #43 | Exceptional $62,658 |
| Cambodians | 100.0 /100 | #44 | Exceptional $62,516 |
| Bulgarians | 100.0 /100 | #45 | Exceptional $62,378 |
| Immigrants | Czechoslovakia | 99.9 /100 | #46 | Exceptional $62,217 |
| Immigrants | Austria | 99.9 /100 | #47 | Exceptional $62,164 |
| Immigrants | Malaysia | 99.9 /100 | #48 | Exceptional $62,121 |
| Immigrants | Europe | 99.9 /100 | #49 | Exceptional $62,057 |
| Bhutanese | 99.9 /100 | #50 | Exceptional $61,759 |
| Estonians | 99.9 /100 | #51 | Exceptional $61,710 |
| Immigrants | Norway | 99.9 /100 | #52 | Exceptional $61,628 |
| South Africans | 99.9 /100 | #53 | Exceptional $61,460 |