Samoan vs Spanish American Indian Unemployment Among Women with Children Ages 6 to 17 years
COMPARE
Samoan
Spanish American Indian
Unemployment Among Women with Children Ages 6 to 17 years
Unemployment Among Women with Children Ages 6 to 17 years Comparison
Samoans
Spanish American Indians
8.4%
UNEMPLOYMENT AMONG WOMEN WITH CHILDREN AGES 6 TO 17 YEARS
99.7/ 100
METRIC RATING
74th/ 347
METRIC RANK
8.2%
UNEMPLOYMENT AMONG WOMEN WITH CHILDREN AGES 6 TO 17 YEARS
100.0/ 100
METRIC RATING
62nd/ 347
METRIC RANK
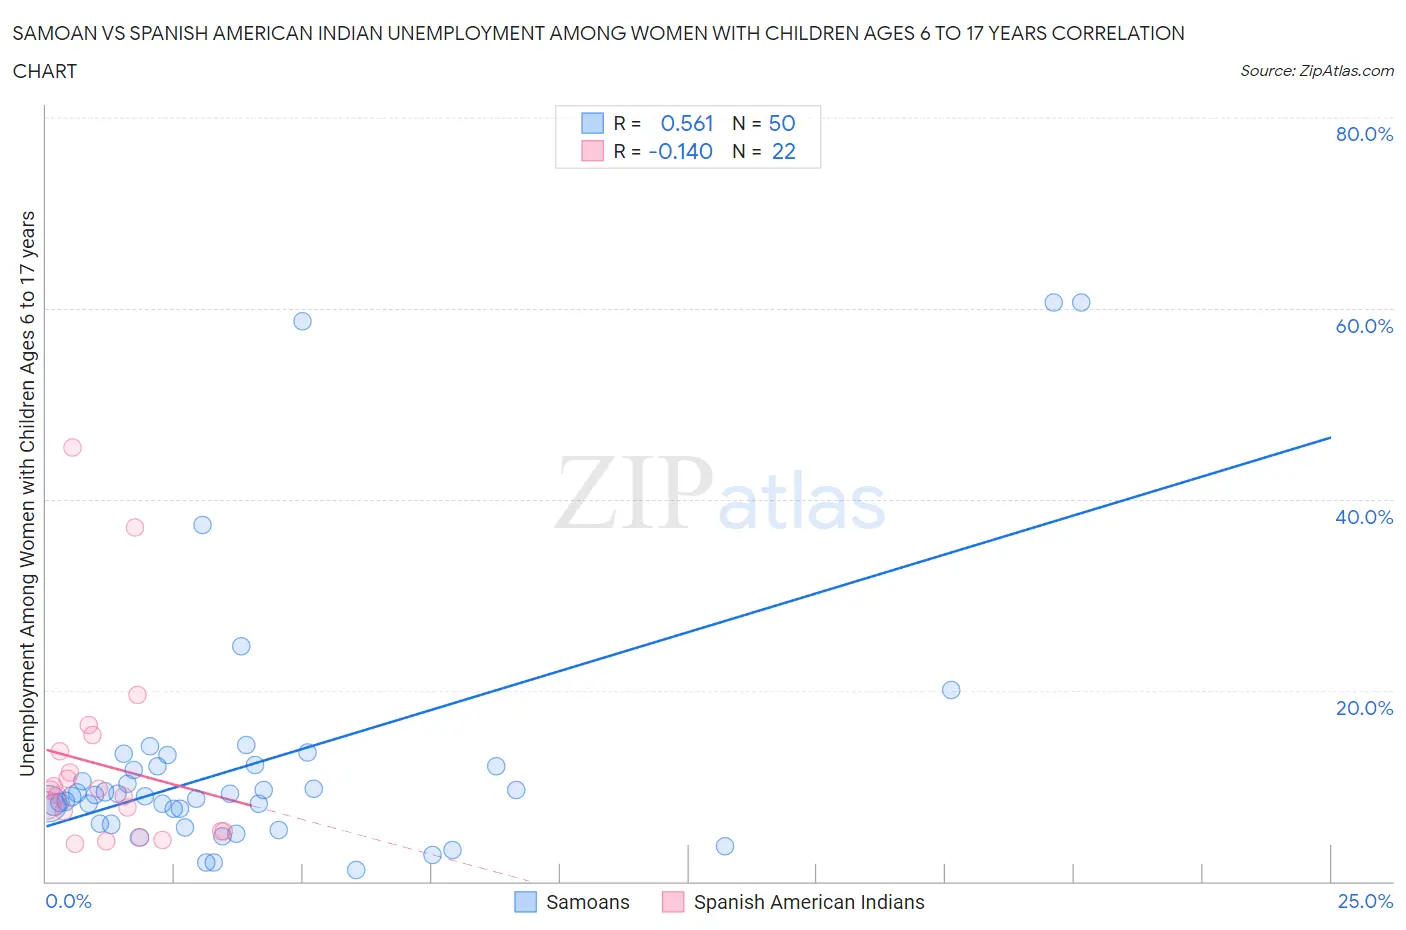
Samoan vs Spanish American Indian Unemployment Among Women with Children Ages 6 to 17 years Correlation Chart
The statistical analysis conducted on geographies consisting of 183,981,110 people shows a substantial positive correlation between the proportion of Samoans and unemployment rate among women with children between the ages 6 and 17 in the United States with a correlation coefficient (R) of 0.561 and weighted average of 8.4%. Similarly, the statistical analysis conducted on geographies consisting of 68,050,108 people shows a poor negative correlation between the proportion of Spanish American Indians and unemployment rate among women with children between the ages 6 and 17 in the United States with a correlation coefficient (R) of -0.140 and weighted average of 8.2%, a difference of 2.2%.
Unemployment Among Women with Children Ages 6 to 17 years Correlation Summary
| Measurement | Samoan | Spanish American Indian |
| Minimum | 1.2% | 4.0% |
| Maximum | 60.6% | 45.4% |
| Range | 59.4% | 41.4% |
| Mean | 12.5% | 12.1% |
| Median | 9.0% | 9.3% |
| Interquartile 25% (IQ1) | 6.0% | 5.3% |
| Interquartile 75% (IQ3) | 12.0% | 13.7% |
| Interquartile Range (IQR) | 6.0% | 8.4% |
| Standard Deviation (Sample) | 13.5% | 10.4% |
| Standard Deviation (Population) | 13.3% | 10.1% |
Demographics Similar to Samoans and Spanish American Indians by Unemployment Among Women with Children Ages 6 to 17 years
In terms of unemployment among women with children ages 6 to 17 years, the demographic groups most similar to Samoans are Immigrants from Sri Lanka (8.4%, a difference of 0.080%), Immigrants from Moldova (8.4%, a difference of 0.11%), Iraqi (8.4%, a difference of 0.16%), Pakistani (8.4%, a difference of 0.29%), and Spanish American (8.4%, a difference of 0.35%). Similarly, the demographic groups most similar to Spanish American Indians are Korean (8.2%, a difference of 0.030%), Immigrants from Philippines (8.2%, a difference of 0.22%), Basque (8.2%, a difference of 0.22%), Immigrants from Malaysia (8.2%, a difference of 0.28%), and Immigrants from South Eastern Asia (8.2%, a difference of 0.40%).
| Demographics | Rating | Rank | Unemployment Among Women with Children Ages 6 to 17 years |
| Immigrants | Malaysia | 100.0 /100 | #58 | Exceptional 8.2% |
| Immigrants | Philippines | 100.0 /100 | #59 | Exceptional 8.2% |
| Basques | 100.0 /100 | #60 | Exceptional 8.2% |
| Koreans | 100.0 /100 | #61 | Exceptional 8.2% |
| Spanish American Indians | 100.0 /100 | #62 | Exceptional 8.2% |
| Immigrants | South Eastern Asia | 99.9 /100 | #63 | Exceptional 8.2% |
| Immigrants | Kuwait | 99.9 /100 | #64 | Exceptional 8.3% |
| Immigrants | Albania | 99.9 /100 | #65 | Exceptional 8.3% |
| Luxembourgers | 99.9 /100 | #66 | Exceptional 8.3% |
| Armenians | 99.9 /100 | #67 | Exceptional 8.3% |
| Marshallese | 99.9 /100 | #68 | Exceptional 8.3% |
| Immigrants | Thailand | 99.9 /100 | #69 | Exceptional 8.3% |
| Norwegians | 99.9 /100 | #70 | Exceptional 8.3% |
| Immigrants | Australia | 99.8 /100 | #71 | Exceptional 8.3% |
| Immigrants | Nepal | 99.8 /100 | #72 | Exceptional 8.3% |
| Spanish Americans | 99.8 /100 | #73 | Exceptional 8.4% |
| Samoans | 99.7 /100 | #74 | Exceptional 8.4% |
| Immigrants | Sri Lanka | 99.7 /100 | #75 | Exceptional 8.4% |
| Immigrants | Moldova | 99.7 /100 | #76 | Exceptional 8.4% |
| Iraqis | 99.7 /100 | #77 | Exceptional 8.4% |
| Pakistanis | 99.6 /100 | #78 | Exceptional 8.4% |