Samoan vs Immigrants from Asia Median Male Earnings
COMPARE
Samoan
Immigrants from Asia
Median Male Earnings
Median Male Earnings Comparison
Samoans
Immigrants from Asia
$51,389
MEDIAN MALE EARNINGS
4.6/ 100
METRIC RATING
228th/ 347
METRIC RANK
$63,240
MEDIAN MALE EARNINGS
100.0/ 100
METRIC RATING
35th/ 347
METRIC RANK
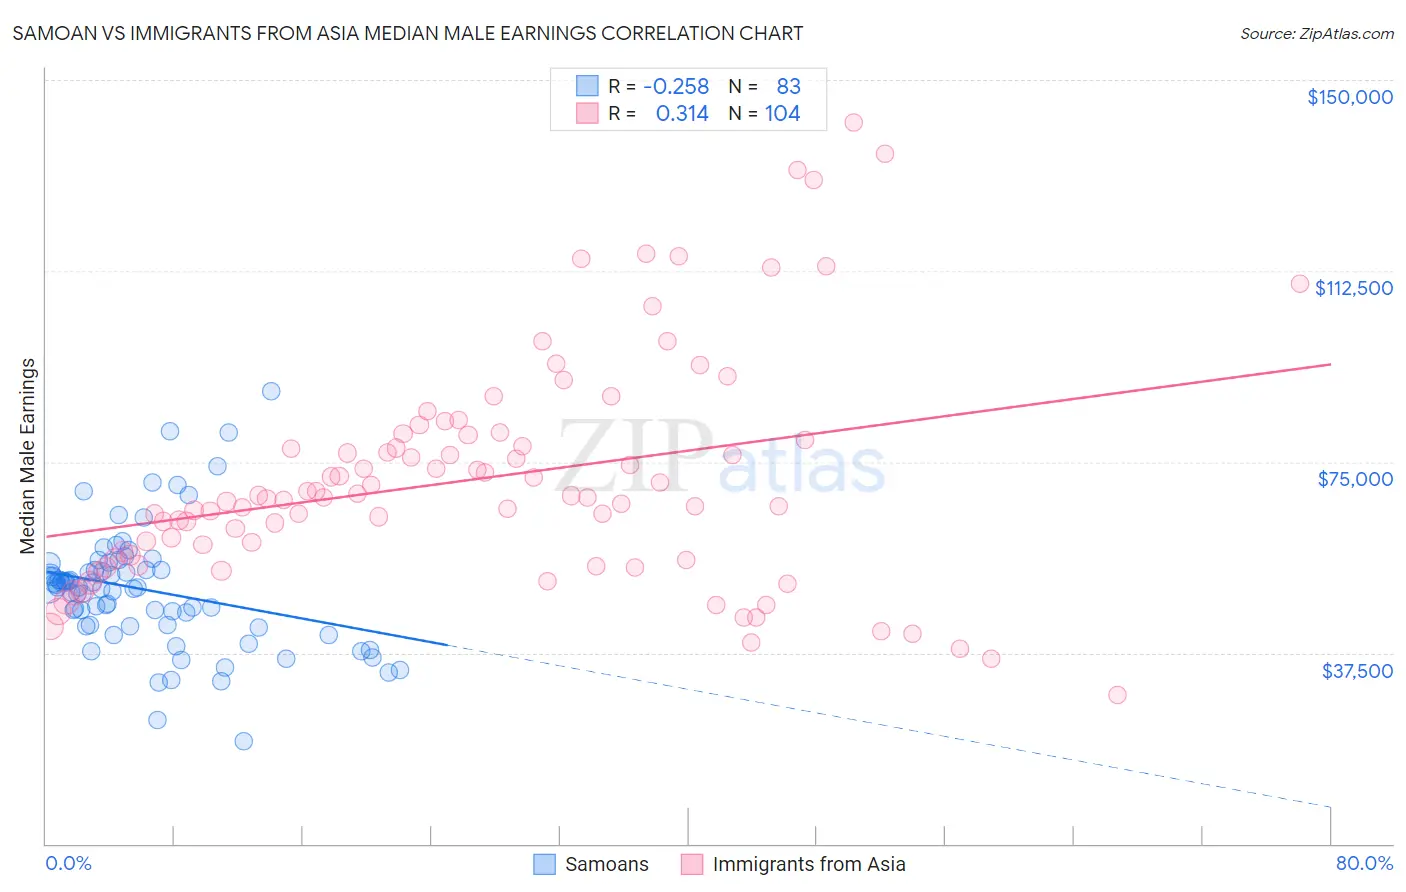
Samoan vs Immigrants from Asia Median Male Earnings Correlation Chart
The statistical analysis conducted on geographies consisting of 225,157,304 people shows a weak negative correlation between the proportion of Samoans and median male earnings in the United States with a correlation coefficient (R) of -0.258 and weighted average of $51,389. Similarly, the statistical analysis conducted on geographies consisting of 548,524,419 people shows a mild positive correlation between the proportion of Immigrants from Asia and median male earnings in the United States with a correlation coefficient (R) of 0.314 and weighted average of $63,240, a difference of 23.1%.
Median Male Earnings Correlation Summary
| Measurement | Samoan | Immigrants from Asia |
| Minimum | $20,179 | $29,236 |
| Maximum | $88,750 | $141,758 |
| Range | $68,571 | $112,522 |
| Mean | $49,891 | $71,617 |
| Median | $50,415 | $67,918 |
| Interquartile 25% (IQ1) | $42,816 | $56,355 |
| Interquartile 75% (IQ3) | $53,887 | $79,747 |
| Interquartile Range (IQR) | $11,071 | $23,393 |
| Standard Deviation (Sample) | $11,942 | $22,311 |
| Standard Deviation (Population) | $11,870 | $22,203 |
Similar Demographics by Median Male Earnings
Demographics Similar to Samoans by Median Male Earnings
In terms of median male earnings, the demographic groups most similar to Samoans are Immigrants from Trinidad and Tobago ($51,376, a difference of 0.030%), Trinidadian and Tobagonian ($51,446, a difference of 0.11%), Japanese ($51,473, a difference of 0.16%), Immigrants from Nigeria ($51,310, a difference of 0.16%), and Immigrants from Sudan ($51,489, a difference of 0.19%).
| Demographics | Rating | Rank | Median Male Earnings |
| Immigrants | Senegal | 5.8 /100 | #221 | Tragic $51,647 |
| Immigrants | Bangladesh | 5.8 /100 | #222 | Tragic $51,642 |
| Ecuadorians | 5.5 /100 | #223 | Tragic $51,596 |
| Immigrants | Cambodia | 5.5 /100 | #224 | Tragic $51,594 |
| Immigrants | Sudan | 5.0 /100 | #225 | Tragic $51,489 |
| Japanese | 4.9 /100 | #226 | Tragic $51,473 |
| Trinidadians and Tobagonians | 4.8 /100 | #227 | Tragic $51,446 |
| Samoans | 4.6 /100 | #228 | Tragic $51,389 |
| Immigrants | Trinidad and Tobago | 4.5 /100 | #229 | Tragic $51,376 |
| Immigrants | Nigeria | 4.2 /100 | #230 | Tragic $51,310 |
| Barbadians | 3.9 /100 | #231 | Tragic $51,236 |
| Sudanese | 3.9 /100 | #232 | Tragic $51,216 |
| Aleuts | 3.7 /100 | #233 | Tragic $51,168 |
| Cape Verdeans | 3.5 /100 | #234 | Tragic $51,103 |
| Immigrants | Western Africa | 3.0 /100 | #235 | Tragic $50,940 |
Demographics Similar to Immigrants from Asia by Median Male Earnings
In terms of median male earnings, the demographic groups most similar to Immigrants from Asia are Israeli ($63,228, a difference of 0.020%), Immigrants from Russia ($63,326, a difference of 0.14%), Immigrants from Lithuania ($63,346, a difference of 0.17%), Soviet Union ($63,382, a difference of 0.22%), and Immigrants from Sri Lanka ($63,099, a difference of 0.22%).
| Demographics | Rating | Rank | Median Male Earnings |
| Russians | 100.0 /100 | #28 | Exceptional $63,939 |
| Asians | 100.0 /100 | #29 | Exceptional $63,827 |
| Immigrants | France | 100.0 /100 | #30 | Exceptional $63,715 |
| Latvians | 100.0 /100 | #31 | Exceptional $63,498 |
| Soviet Union | 100.0 /100 | #32 | Exceptional $63,382 |
| Immigrants | Lithuania | 100.0 /100 | #33 | Exceptional $63,346 |
| Immigrants | Russia | 100.0 /100 | #34 | Exceptional $63,326 |
| Immigrants | Asia | 100.0 /100 | #35 | Exceptional $63,240 |
| Israelis | 100.0 /100 | #36 | Exceptional $63,228 |
| Immigrants | Sri Lanka | 100.0 /100 | #37 | Exceptional $63,099 |
| Maltese | 100.0 /100 | #38 | Exceptional $62,953 |
| Immigrants | South Africa | 100.0 /100 | #39 | Exceptional $62,899 |
| Australians | 100.0 /100 | #40 | Exceptional $62,857 |
| Immigrants | Turkey | 100.0 /100 | #41 | Exceptional $62,728 |
| Immigrants | Greece | 100.0 /100 | #42 | Exceptional $62,689 |