Samoan vs Spanish American Indian Female Poverty Among 25-34 Year Olds
COMPARE
Samoan
Spanish American Indian
Female Poverty Among 25-34 Year Olds
Female Poverty Among 25-34 Year Olds Comparison
Samoans
Spanish American Indians
13.5%
FEMALE POVERTY AMONG 25-34 YEAR OLDS
56.8/ 100
METRIC RATING
169th/ 347
METRIC RANK
14.3%
FEMALE POVERTY AMONG 25-34 YEAR OLDS
5.5/ 100
METRIC RATING
217th/ 347
METRIC RANK
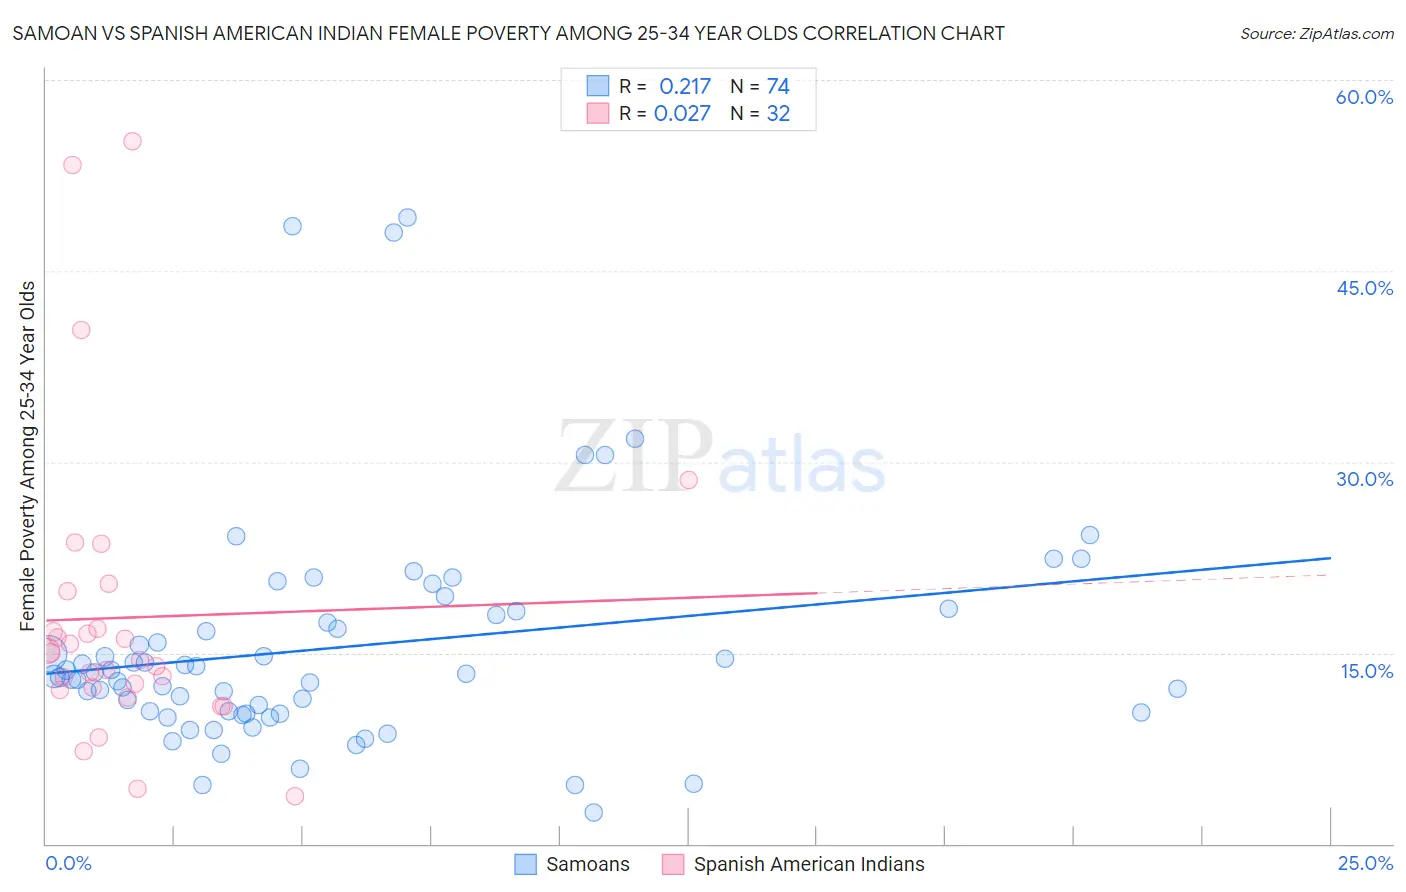
Samoan vs Spanish American Indian Female Poverty Among 25-34 Year Olds Correlation Chart
The statistical analysis conducted on geographies consisting of 223,994,438 people shows a weak positive correlation between the proportion of Samoans and poverty level among females between the ages 25 and 34 in the United States with a correlation coefficient (R) of 0.217 and weighted average of 13.5%. Similarly, the statistical analysis conducted on geographies consisting of 73,082,371 people shows no correlation between the proportion of Spanish American Indians and poverty level among females between the ages 25 and 34 in the United States with a correlation coefficient (R) of 0.027 and weighted average of 14.3%, a difference of 6.5%.
Female Poverty Among 25-34 Year Olds Correlation Summary
| Measurement | Samoan | Spanish American Indian |
| Minimum | 2.5% | 3.8% |
| Maximum | 49.2% | 55.2% |
| Range | 46.7% | 51.5% |
| Mean | 15.4% | 17.8% |
| Median | 13.3% | 14.7% |
| Interquartile 25% (IQ1) | 10.3% | 12.2% |
| Interquartile 75% (IQ3) | 18.0% | 18.4% |
| Interquartile Range (IQR) | 7.7% | 6.2% |
| Standard Deviation (Sample) | 9.0% | 11.8% |
| Standard Deviation (Population) | 8.9% | 11.6% |
Similar Demographics by Female Poverty Among 25-34 Year Olds
Demographics Similar to Samoans by Female Poverty Among 25-34 Year Olds
In terms of female poverty among 25-34 year olds, the demographic groups most similar to Samoans are Immigrants from Afghanistan (13.4%, a difference of 0.080%), Immigrants from Bosnia and Herzegovina (13.4%, a difference of 0.16%), Belgian (13.4%, a difference of 0.18%), Basque (13.4%, a difference of 0.21%), and Immigrants from Uganda (13.5%, a difference of 0.32%).
| Demographics | Rating | Rank | Female Poverty Among 25-34 Year Olds |
| Ugandans | 64.1 /100 | #162 | Good 13.4% |
| British | 63.5 /100 | #163 | Good 13.4% |
| Swiss | 61.7 /100 | #164 | Good 13.4% |
| Basques | 59.3 /100 | #165 | Average 13.4% |
| Belgians | 58.9 /100 | #166 | Average 13.4% |
| Immigrants | Bosnia and Herzegovina | 58.6 /100 | #167 | Average 13.4% |
| Immigrants | Afghanistan | 57.7 /100 | #168 | Average 13.4% |
| Samoans | 56.8 /100 | #169 | Average 13.5% |
| Immigrants | Uganda | 53.0 /100 | #170 | Average 13.5% |
| South American Indians | 51.9 /100 | #171 | Average 13.5% |
| Immigrants | Costa Rica | 51.9 /100 | #172 | Average 13.5% |
| Kenyans | 51.8 /100 | #173 | Average 13.5% |
| Immigrants | Oceania | 50.0 /100 | #174 | Average 13.5% |
| Bermudans | 46.8 /100 | #175 | Average 13.6% |
| Yugoslavians | 45.0 /100 | #176 | Average 13.6% |
Demographics Similar to Spanish American Indians by Female Poverty Among 25-34 Year Olds
In terms of female poverty among 25-34 year olds, the demographic groups most similar to Spanish American Indians are French Canadian (14.3%, a difference of 0.0%), Immigrants from Thailand (14.3%, a difference of 0.11%), Ecuadorian (14.3%, a difference of 0.11%), Immigrants from Nigeria (14.3%, a difference of 0.25%), and French (14.3%, a difference of 0.27%).
| Demographics | Rating | Rank | Female Poverty Among 25-34 Year Olds |
| Panamanians | 8.6 /100 | #210 | Tragic 14.2% |
| Trinidadians and Tobagonians | 8.2 /100 | #211 | Tragic 14.2% |
| Immigrants | Guyana | 6.6 /100 | #212 | Tragic 14.3% |
| Puget Sound Salish | 6.5 /100 | #213 | Tragic 14.3% |
| French | 6.2 /100 | #214 | Tragic 14.3% |
| Immigrants | Nigeria | 6.2 /100 | #215 | Tragic 14.3% |
| French Canadians | 5.5 /100 | #216 | Tragic 14.3% |
| Spanish American Indians | 5.5 /100 | #217 | Tragic 14.3% |
| Immigrants | Thailand | 5.2 /100 | #218 | Tragic 14.3% |
| Ecuadorians | 5.2 /100 | #219 | Tragic 14.3% |
| Ghanaians | 4.8 /100 | #220 | Tragic 14.4% |
| Sudanese | 4.4 /100 | #221 | Tragic 14.4% |
| Immigrants | Portugal | 4.3 /100 | #222 | Tragic 14.4% |
| Nigerians | 4.2 /100 | #223 | Tragic 14.4% |
| Immigrants | Sudan | 4.0 /100 | #224 | Tragic 14.4% |