Immigrants from Malaysia vs Immigrants from Honduras Householder Income Ages 45 - 64 years
COMPARE
Immigrants from Malaysia
Immigrants from Honduras
Householder Income Ages 45 - 64 years
Householder Income Ages 45 - 64 years Comparison
Immigrants from Malaysia
Immigrants from Honduras
$112,796
HOUSEHOLDER INCOME AGES 45 - 64 YEARS
99.8/ 100
METRIC RATING
52nd/ 347
METRIC RANK
$82,697
HOUSEHOLDER INCOME AGES 45 - 64 YEARS
0.0/ 100
METRIC RATING
314th/ 347
METRIC RANK
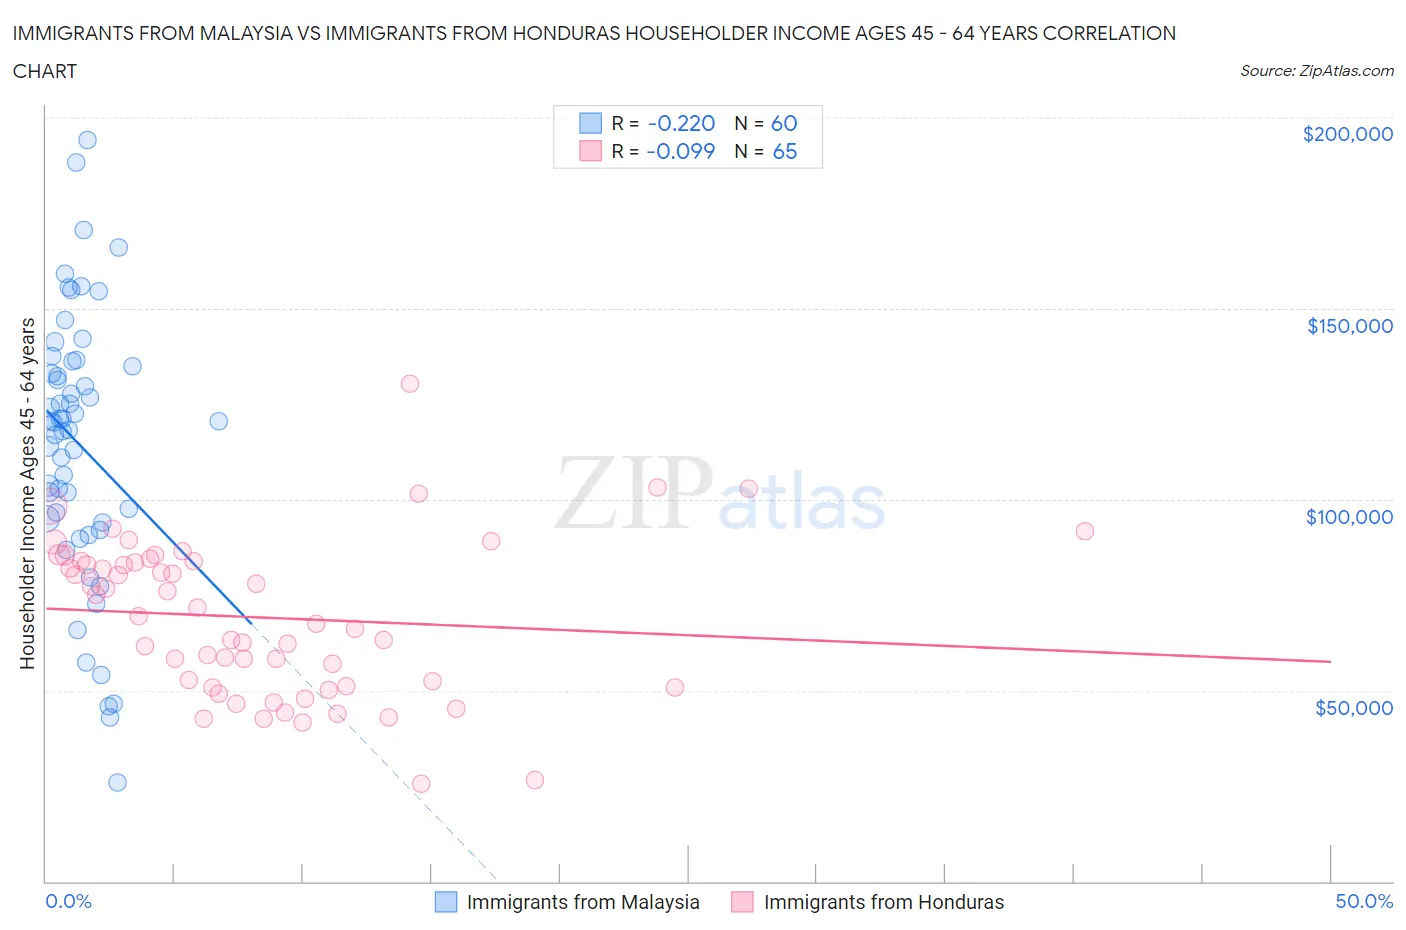
Immigrants from Malaysia vs Immigrants from Honduras Householder Income Ages 45 - 64 years Correlation Chart
The statistical analysis conducted on geographies consisting of 197,847,367 people shows a weak negative correlation between the proportion of Immigrants from Malaysia and household income with householder between the ages 45 and 64 in the United States with a correlation coefficient (R) of -0.220 and weighted average of $112,796. Similarly, the statistical analysis conducted on geographies consisting of 322,186,782 people shows a slight negative correlation between the proportion of Immigrants from Honduras and household income with householder between the ages 45 and 64 in the United States with a correlation coefficient (R) of -0.099 and weighted average of $82,697, a difference of 36.4%.
Householder Income Ages 45 - 64 years Correlation Summary
| Measurement | Immigrants from Malaysia | Immigrants from Honduras |
| Minimum | $25,952 | $25,625 |
| Maximum | $194,219 | $130,200 |
| Range | $168,267 | $104,575 |
| Mean | $114,501 | $69,055 |
| Median | $120,322 | $69,386 |
| Interquartile 25% (IQ1) | $94,457 | $50,934 |
| Interquartile 75% (IQ3) | $135,508 | $83,889 |
| Interquartile Range (IQR) | $41,051 | $32,956 |
| Standard Deviation (Sample) | $35,239 | $20,449 |
| Standard Deviation (Population) | $34,945 | $20,291 |
Similar Demographics by Householder Income Ages 45 - 64 years
Demographics Similar to Immigrants from Malaysia by Householder Income Ages 45 - 64 years
In terms of householder income ages 45 - 64 years, the demographic groups most similar to Immigrants from Malaysia are Immigrants from South Africa ($112,886, a difference of 0.080%), Afghan ($112,676, a difference of 0.11%), Greek ($112,630, a difference of 0.15%), Lithuanian ($112,484, a difference of 0.28%), and Immigrants from Austria ($113,140, a difference of 0.30%).
| Demographics | Rating | Rank | Householder Income Ages 45 - 64 years |
| Immigrants | France | 99.9 /100 | #45 | Exceptional $113,680 |
| Immigrants | Greece | 99.9 /100 | #46 | Exceptional $113,548 |
| Australians | 99.9 /100 | #47 | Exceptional $113,533 |
| Immigrants | Indonesia | 99.9 /100 | #48 | Exceptional $113,519 |
| Immigrants | Russia | 99.8 /100 | #49 | Exceptional $113,215 |
| Immigrants | Austria | 99.8 /100 | #50 | Exceptional $113,140 |
| Immigrants | South Africa | 99.8 /100 | #51 | Exceptional $112,886 |
| Immigrants | Malaysia | 99.8 /100 | #52 | Exceptional $112,796 |
| Afghans | 99.8 /100 | #53 | Exceptional $112,676 |
| Greeks | 99.8 /100 | #54 | Exceptional $112,630 |
| Lithuanians | 99.8 /100 | #55 | Exceptional $112,484 |
| Egyptians | 99.7 /100 | #56 | Exceptional $112,256 |
| Immigrants | Scotland | 99.7 /100 | #57 | Exceptional $112,175 |
| Soviet Union | 99.7 /100 | #58 | Exceptional $112,008 |
| Immigrants | Europe | 99.7 /100 | #59 | Exceptional $111,984 |
Demographics Similar to Immigrants from Honduras by Householder Income Ages 45 - 64 years
In terms of householder income ages 45 - 64 years, the demographic groups most similar to Immigrants from Honduras are U.S. Virgin Islander ($82,736, a difference of 0.050%), Paiute ($82,629, a difference of 0.080%), Immigrants from Caribbean ($82,513, a difference of 0.22%), Colville ($82,474, a difference of 0.27%), and Cajun ($83,015, a difference of 0.39%).
| Demographics | Rating | Rank | Householder Income Ages 45 - 64 years |
| Shoshone | 0.0 /100 | #307 | Tragic $83,588 |
| Immigrants | Cabo Verde | 0.0 /100 | #308 | Tragic $83,542 |
| Immigrants | Dominica | 0.0 /100 | #309 | Tragic $83,311 |
| Immigrants | Haiti | 0.0 /100 | #310 | Tragic $83,257 |
| Immigrants | Bahamas | 0.0 /100 | #311 | Tragic $83,177 |
| Cajuns | 0.0 /100 | #312 | Tragic $83,015 |
| U.S. Virgin Islanders | 0.0 /100 | #313 | Tragic $82,736 |
| Immigrants | Honduras | 0.0 /100 | #314 | Tragic $82,697 |
| Paiute | 0.0 /100 | #315 | Tragic $82,629 |
| Immigrants | Caribbean | 0.0 /100 | #316 | Tragic $82,513 |
| Colville | 0.0 /100 | #317 | Tragic $82,474 |
| Choctaw | 0.0 /100 | #318 | Tragic $82,287 |
| Chickasaw | 0.0 /100 | #319 | Tragic $82,193 |
| Apache | 0.0 /100 | #320 | Tragic $82,184 |
| Yuman | 0.0 /100 | #321 | Tragic $82,139 |