Samoan vs Immigrants from Honduras 8th Grade
COMPARE
Samoan
Immigrants from Honduras
8th Grade
8th Grade Comparison
Samoans
Immigrants from Honduras
95.4%
8TH GRADE
8.4/ 100
METRIC RATING
216th/ 347
METRIC RANK
91.9%
8TH GRADE
0.0/ 100
METRIC RATING
336th/ 347
METRIC RANK
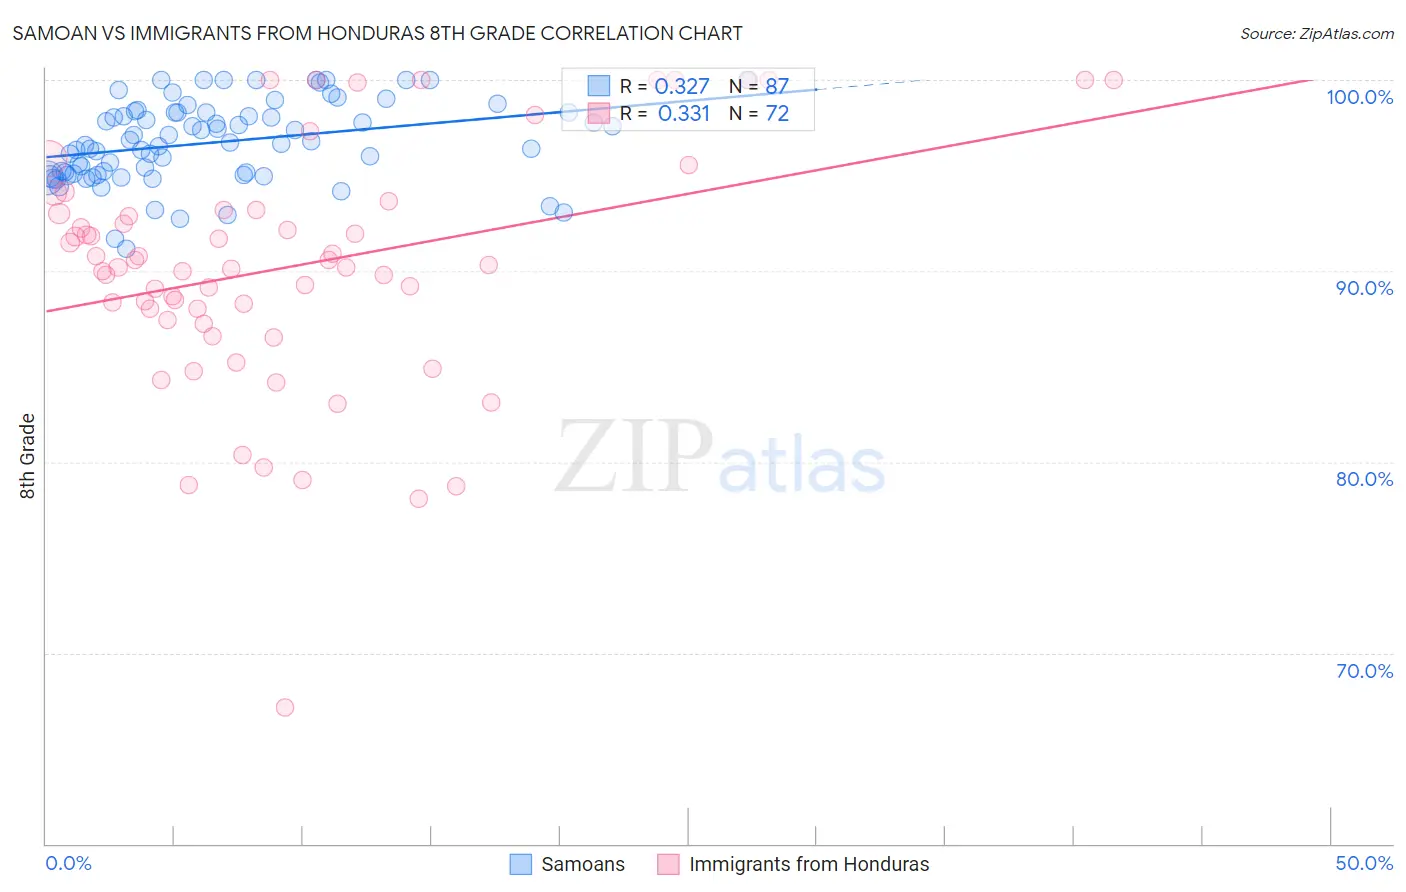
Samoan vs Immigrants from Honduras 8th Grade Correlation Chart
The statistical analysis conducted on geographies consisting of 225,201,909 people shows a mild positive correlation between the proportion of Samoans and percentage of population with at least 8th grade education in the United States with a correlation coefficient (R) of 0.327 and weighted average of 95.4%. Similarly, the statistical analysis conducted on geographies consisting of 322,637,445 people shows a mild positive correlation between the proportion of Immigrants from Honduras and percentage of population with at least 8th grade education in the United States with a correlation coefficient (R) of 0.331 and weighted average of 91.9%, a difference of 3.7%.
8th Grade Correlation Summary
| Measurement | Samoan | Immigrants from Honduras |
| Minimum | 91.1% | 67.1% |
| Maximum | 100.0% | 100.0% |
| Range | 8.9% | 32.9% |
| Mean | 96.7% | 90.2% |
| Median | 96.7% | 90.2% |
| Interquartile 25% (IQ1) | 95.0% | 87.7% |
| Interquartile 75% (IQ3) | 98.3% | 93.2% |
| Interquartile Range (IQR) | 3.3% | 5.5% |
| Standard Deviation (Sample) | 2.1% | 6.3% |
| Standard Deviation (Population) | 2.1% | 6.3% |
Similar Demographics by 8th Grade
Demographics Similar to Samoans by 8th Grade
In terms of 8th grade, the demographic groups most similar to Samoans are Immigrants from Eastern Asia (95.4%, a difference of 0.0%), Laotian (95.4%, a difference of 0.010%), Immigrants from Chile (95.4%, a difference of 0.010%), Immigrants from Liberia (95.4%, a difference of 0.010%), and Dutch West Indian (95.4%, a difference of 0.010%).
| Demographics | Rating | Rank | 8th Grade |
| Immigrants | Lebanon | 13.7 /100 | #209 | Poor 95.4% |
| Africans | 13.6 /100 | #210 | Poor 95.4% |
| Immigrants | Morocco | 12.4 /100 | #211 | Poor 95.4% |
| Immigrants | Pakistan | 9.7 /100 | #212 | Tragic 95.4% |
| Laotians | 9.0 /100 | #213 | Tragic 95.4% |
| Immigrants | Chile | 9.0 /100 | #214 | Tragic 95.4% |
| Immigrants | Liberia | 8.9 /100 | #215 | Tragic 95.4% |
| Samoans | 8.4 /100 | #216 | Tragic 95.4% |
| Immigrants | Eastern Asia | 8.3 /100 | #217 | Tragic 95.4% |
| Dutch West Indians | 8.1 /100 | #218 | Tragic 95.4% |
| Spanish Americans | 8.0 /100 | #219 | Tragic 95.4% |
| Immigrants | Southern Europe | 7.7 /100 | #220 | Tragic 95.3% |
| Immigrants | Syria | 7.4 /100 | #221 | Tragic 95.3% |
| Immigrants | Malaysia | 7.3 /100 | #222 | Tragic 95.3% |
| Immigrants | Oceania | 7.1 /100 | #223 | Tragic 95.3% |
Demographics Similar to Immigrants from Honduras by 8th Grade
In terms of 8th grade, the demographic groups most similar to Immigrants from Honduras are Mexican American Indian (92.1%, a difference of 0.19%), Immigrants from Latin America (91.7%, a difference of 0.23%), Immigrants from Yemen (92.1%, a difference of 0.24%), Hispanic or Latino (92.2%, a difference of 0.30%), and Central American (91.6%, a difference of 0.37%).
| Demographics | Rating | Rank | 8th Grade |
| Immigrants | Cabo Verde | 0.0 /100 | #329 | Tragic 92.4% |
| Immigrants | Armenia | 0.0 /100 | #330 | Tragic 92.3% |
| Hondurans | 0.0 /100 | #331 | Tragic 92.3% |
| Immigrants | Dominican Republic | 0.0 /100 | #332 | Tragic 92.3% |
| Hispanics or Latinos | 0.0 /100 | #333 | Tragic 92.2% |
| Immigrants | Yemen | 0.0 /100 | #334 | Tragic 92.1% |
| Mexican American Indians | 0.0 /100 | #335 | Tragic 92.1% |
| Immigrants | Honduras | 0.0 /100 | #336 | Tragic 91.9% |
| Immigrants | Latin America | 0.0 /100 | #337 | Tragic 91.7% |
| Central Americans | 0.0 /100 | #338 | Tragic 91.6% |
| Mexicans | 0.0 /100 | #339 | Tragic 91.4% |
| Yakama | 0.0 /100 | #340 | Tragic 91.2% |
| Guatemalans | 0.0 /100 | #341 | Tragic 91.1% |
| Salvadorans | 0.0 /100 | #342 | Tragic 90.9% |
| Immigrants | Guatemala | 0.0 /100 | #343 | Tragic 90.7% |