Samoan vs Immigrants from Honduras Householder Income Over 65 years
COMPARE
Samoan
Immigrants from Honduras
Householder Income Over 65 years
Householder Income Over 65 years Comparison
Samoans
Immigrants from Honduras
$65,427
HOUSEHOLDER INCOME OVER 65 YEARS
99.1/ 100
METRIC RATING
69th/ 347
METRIC RANK
$51,888
HOUSEHOLDER INCOME OVER 65 YEARS
0.0/ 100
METRIC RATING
319th/ 347
METRIC RANK
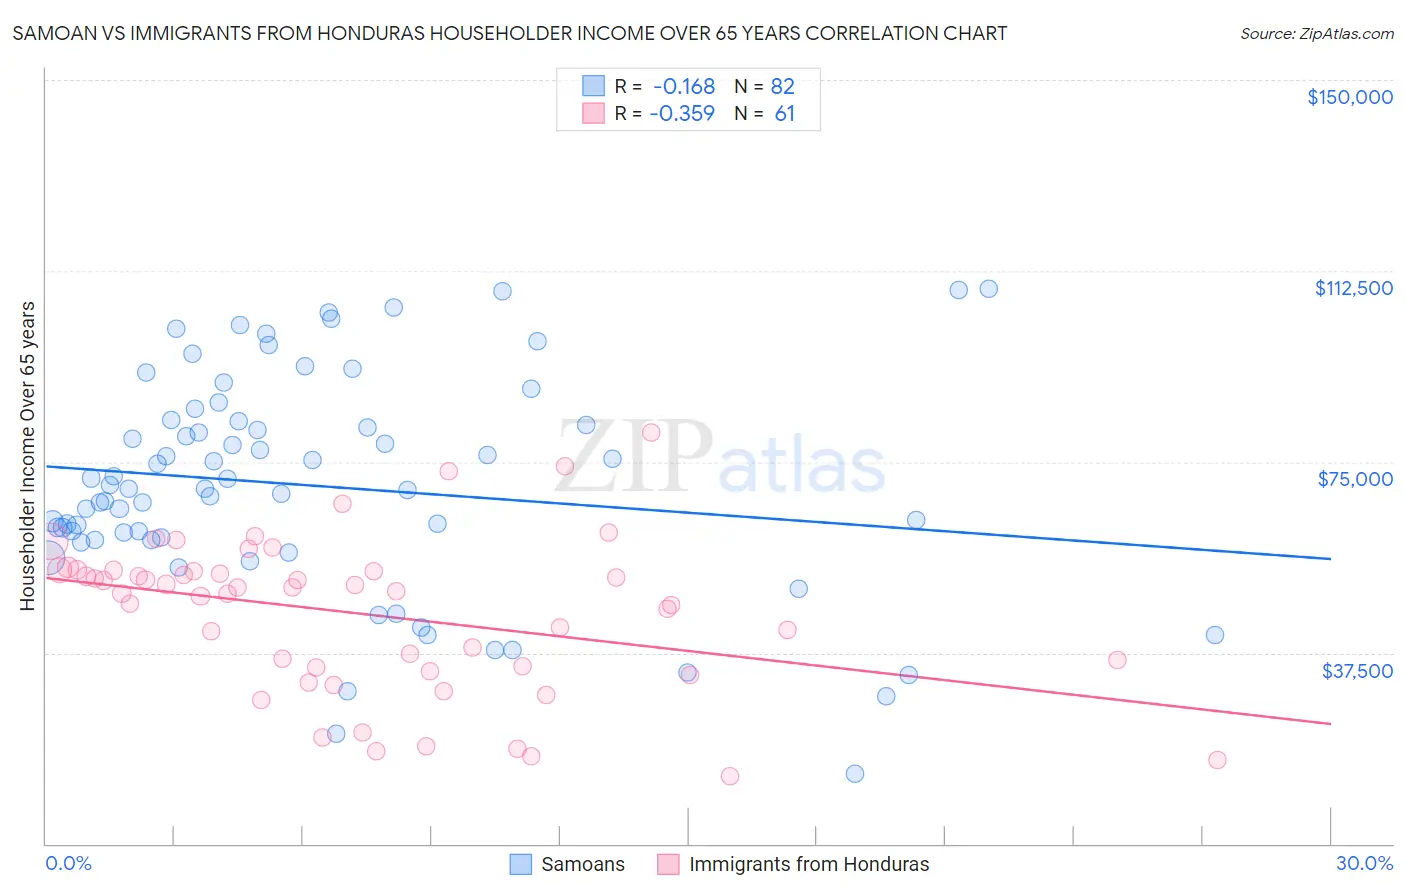
Samoan vs Immigrants from Honduras Householder Income Over 65 years Correlation Chart
The statistical analysis conducted on geographies consisting of 224,404,839 people shows a poor negative correlation between the proportion of Samoans and household income with householder over the age of 65 in the United States with a correlation coefficient (R) of -0.168 and weighted average of $65,427. Similarly, the statistical analysis conducted on geographies consisting of 321,788,463 people shows a mild negative correlation between the proportion of Immigrants from Honduras and household income with householder over the age of 65 in the United States with a correlation coefficient (R) of -0.359 and weighted average of $51,888, a difference of 26.1%.
Householder Income Over 65 years Correlation Summary
| Measurement | Samoan | Immigrants from Honduras |
| Minimum | $13,651 | $13,371 |
| Maximum | $108,977 | $80,682 |
| Range | $95,326 | $67,311 |
| Mean | $70,206 | $45,102 |
| Median | $69,618 | $49,642 |
| Interquartile 25% (IQ1) | $59,611 | $34,344 |
| Interquartile 75% (IQ3) | $83,086 | $53,638 |
| Interquartile Range (IQR) | $23,475 | $19,294 |
| Standard Deviation (Sample) | $21,405 | $15,103 |
| Standard Deviation (Population) | $21,274 | $14,979 |
Similar Demographics by Householder Income Over 65 years
Demographics Similar to Samoans by Householder Income Over 65 years
In terms of householder income over 65 years, the demographic groups most similar to Samoans are Egyptian ($65,441, a difference of 0.020%), Immigrants from Malaysia ($65,497, a difference of 0.11%), Mongolian ($65,326, a difference of 0.15%), Greek ($65,306, a difference of 0.19%), and Argentinean ($65,246, a difference of 0.28%).
| Demographics | Rating | Rank | Householder Income Over 65 years |
| Immigrants | Sierra Leone | 99.5 /100 | #62 | Exceptional $66,009 |
| Marshallese | 99.4 /100 | #63 | Exceptional $65,874 |
| Zimbabweans | 99.4 /100 | #64 | Exceptional $65,854 |
| Immigrants | England | 99.3 /100 | #65 | Exceptional $65,715 |
| South Africans | 99.3 /100 | #66 | Exceptional $65,652 |
| Immigrants | Malaysia | 99.1 /100 | #67 | Exceptional $65,497 |
| Egyptians | 99.1 /100 | #68 | Exceptional $65,441 |
| Samoans | 99.1 /100 | #69 | Exceptional $65,427 |
| Mongolians | 99.0 /100 | #70 | Exceptional $65,326 |
| Greeks | 98.9 /100 | #71 | Exceptional $65,306 |
| Argentineans | 98.9 /100 | #72 | Exceptional $65,246 |
| Immigrants | Ethiopia | 98.9 /100 | #73 | Exceptional $65,238 |
| Lithuanians | 98.8 /100 | #74 | Exceptional $65,209 |
| Sierra Leoneans | 98.6 /100 | #75 | Exceptional $65,038 |
| Ethiopians | 98.5 /100 | #76 | Exceptional $64,989 |
Demographics Similar to Immigrants from Honduras by Householder Income Over 65 years
In terms of householder income over 65 years, the demographic groups most similar to Immigrants from Honduras are Haitian ($51,912, a difference of 0.050%), Immigrants from St. Vincent and the Grenadines ($51,922, a difference of 0.070%), Creek ($51,949, a difference of 0.12%), Colville ($51,739, a difference of 0.29%), and Menominee ($51,719, a difference of 0.33%).
| Demographics | Rating | Rank | Householder Income Over 65 years |
| Immigrants | Azores | 0.0 /100 | #312 | Tragic $52,121 |
| Immigrants | Nicaragua | 0.0 /100 | #313 | Tragic $52,085 |
| Natives/Alaskans | 0.0 /100 | #314 | Tragic $52,081 |
| U.S. Virgin Islanders | 0.0 /100 | #315 | Tragic $52,072 |
| Creek | 0.0 /100 | #316 | Tragic $51,949 |
| Immigrants | St. Vincent and the Grenadines | 0.0 /100 | #317 | Tragic $51,922 |
| Haitians | 0.0 /100 | #318 | Tragic $51,912 |
| Immigrants | Honduras | 0.0 /100 | #319 | Tragic $51,888 |
| Colville | 0.0 /100 | #320 | Tragic $51,739 |
| Menominee | 0.0 /100 | #321 | Tragic $51,719 |
| British West Indians | 0.0 /100 | #322 | Tragic $51,463 |
| Cajuns | 0.0 /100 | #323 | Tragic $51,397 |
| Immigrants | Congo | 0.0 /100 | #324 | Tragic $51,393 |
| Immigrants | Haiti | 0.0 /100 | #325 | Tragic $51,219 |
| Kiowa | 0.0 /100 | #326 | Tragic $51,140 |