Samoan vs Immigrants from Armenia Births to Unmarried Women
COMPARE
Samoan
Immigrants from Armenia
Births to Unmarried Women
Births to Unmarried Women Comparison
Samoans
Immigrants from Armenia
32.6%
BIRTHS TO UNMARRIED WOMEN
21.9/ 100
METRIC RATING
195th/ 347
METRIC RANK
26.1%
BIRTHS TO UNMARRIED WOMEN
99.9/ 100
METRIC RATING
18th/ 347
METRIC RANK
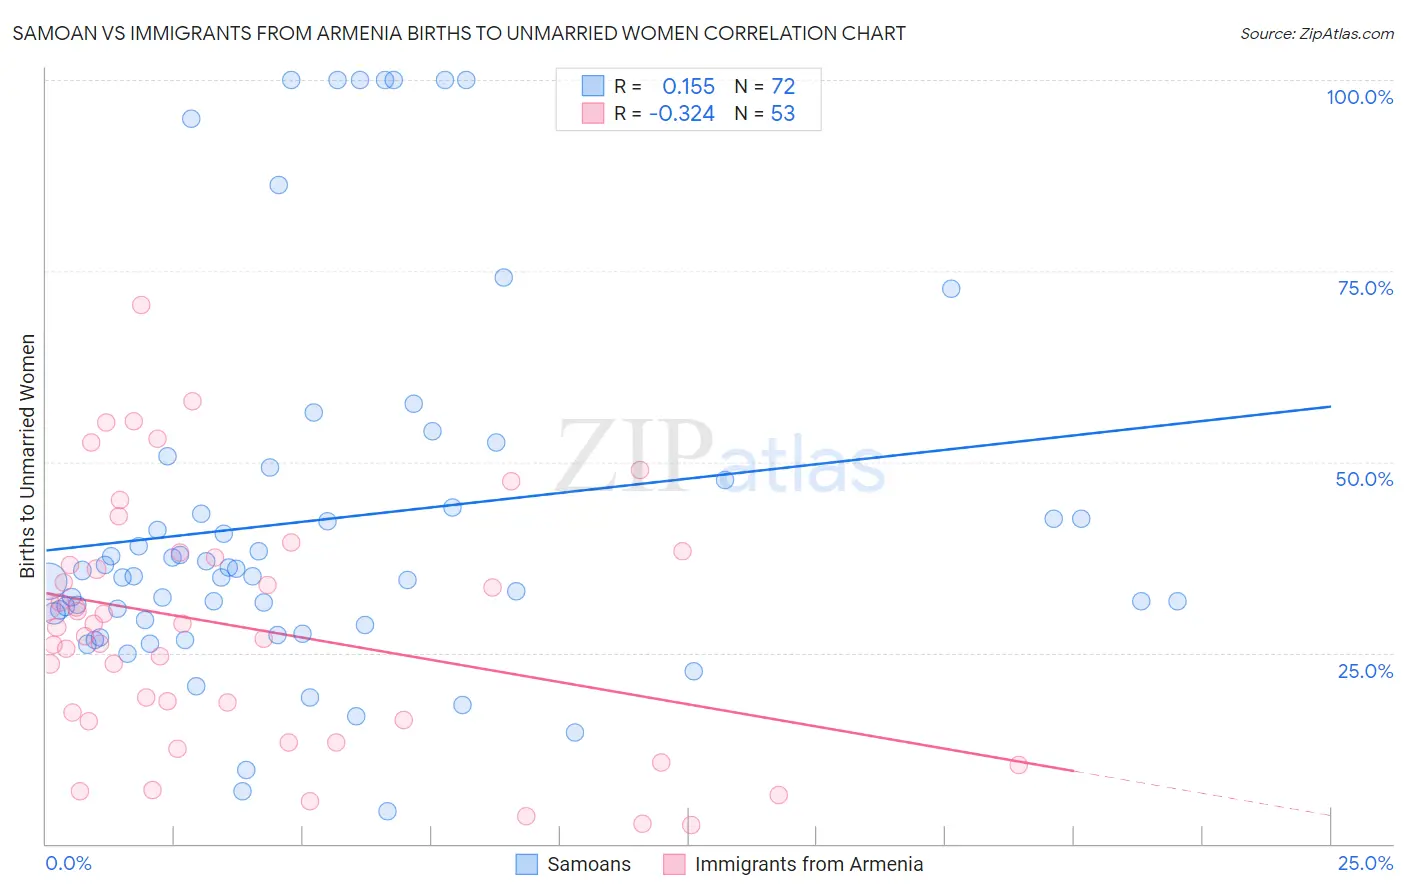
Samoan vs Immigrants from Armenia Births to Unmarried Women Correlation Chart
The statistical analysis conducted on geographies consisting of 217,867,082 people shows a poor positive correlation between the proportion of Samoans and percentage of births to unmarried women in the United States with a correlation coefficient (R) of 0.155 and weighted average of 32.6%. Similarly, the statistical analysis conducted on geographies consisting of 94,792,248 people shows a mild negative correlation between the proportion of Immigrants from Armenia and percentage of births to unmarried women in the United States with a correlation coefficient (R) of -0.324 and weighted average of 26.1%, a difference of 25.2%.
Births to Unmarried Women Correlation Summary
| Measurement | Samoan | Immigrants from Armenia |
| Minimum | 4.3% | 2.5% |
| Maximum | 100.0% | 70.6% |
| Range | 95.7% | 68.1% |
| Mean | 42.4% | 28.3% |
| Median | 35.0% | 28.3% |
| Interquartile 25% (IQ1) | 28.9% | 16.1% |
| Interquartile 75% (IQ3) | 45.8% | 37.8% |
| Interquartile Range (IQR) | 16.9% | 21.7% |
| Standard Deviation (Sample) | 24.4% | 16.0% |
| Standard Deviation (Population) | 24.2% | 15.8% |
Similar Demographics by Births to Unmarried Women
Demographics Similar to Samoans by Births to Unmarried Women
In terms of births to unmarried women, the demographic groups most similar to Samoans are Immigrants from Colombia (32.6%, a difference of 0.030%), Immigrants (32.7%, a difference of 0.18%), Costa Rican (32.7%, a difference of 0.23%), Immigrants from Thailand (32.8%, a difference of 0.43%), and Immigrants from Germany (32.8%, a difference of 0.44%).
| Demographics | Rating | Rank | Births to Unmarried Women |
| Osage | 37.1 /100 | #188 | Fair 32.1% |
| Immigrants | Kenya | 36.9 /100 | #189 | Fair 32.1% |
| Tlingit-Haida | 32.6 /100 | #190 | Fair 32.2% |
| Irish | 32.4 /100 | #191 | Fair 32.2% |
| Colombians | 31.9 /100 | #192 | Fair 32.2% |
| Fijians | 31.1 /100 | #193 | Fair 32.3% |
| Sudanese | 27.3 /100 | #194 | Fair 32.4% |
| Samoans | 21.9 /100 | #195 | Fair 32.6% |
| Immigrants | Colombia | 21.7 /100 | #196 | Fair 32.6% |
| Immigrants | Immigrants | 20.6 /100 | #197 | Fair 32.7% |
| Costa Ricans | 20.3 /100 | #198 | Fair 32.7% |
| Immigrants | Thailand | 18.9 /100 | #199 | Poor 32.8% |
| Immigrants | Germany | 18.8 /100 | #200 | Poor 32.8% |
| Immigrants | Burma/Myanmar | 16.7 /100 | #201 | Poor 32.9% |
| Immigrants | Micronesia | 16.6 /100 | #202 | Poor 32.9% |
Demographics Similar to Immigrants from Armenia by Births to Unmarried Women
In terms of births to unmarried women, the demographic groups most similar to Immigrants from Armenia are Armenian (26.2%, a difference of 0.58%), Immigrants from Korea (26.3%, a difference of 0.80%), Soviet Union (26.3%, a difference of 0.93%), Immigrants from Uzbekistan (25.8%, a difference of 1.1%), and Burmese (26.4%, a difference of 1.2%).
| Demographics | Rating | Rank | Births to Unmarried Women |
| Immigrants | Israel | 100.0 /100 | #11 | Exceptional 25.1% |
| Indians (Asian) | 100.0 /100 | #12 | Exceptional 25.3% |
| Iranians | 100.0 /100 | #13 | Exceptional 25.3% |
| Immigrants | Lebanon | 100.0 /100 | #14 | Exceptional 25.3% |
| Immigrants | Singapore | 100.0 /100 | #15 | Exceptional 25.6% |
| Immigrants | Belarus | 100.0 /100 | #16 | Exceptional 25.6% |
| Immigrants | Uzbekistan | 100.0 /100 | #17 | Exceptional 25.8% |
| Immigrants | Armenia | 99.9 /100 | #18 | Exceptional 26.1% |
| Armenians | 99.9 /100 | #19 | Exceptional 26.2% |
| Immigrants | Korea | 99.9 /100 | #20 | Exceptional 26.3% |
| Soviet Union | 99.9 /100 | #21 | Exceptional 26.3% |
| Burmese | 99.9 /100 | #22 | Exceptional 26.4% |
| Immigrants | Japan | 99.9 /100 | #23 | Exceptional 26.4% |
| Immigrants | Australia | 99.9 /100 | #24 | Exceptional 26.6% |
| Cambodians | 99.9 /100 | #25 | Exceptional 26.7% |