Salvadoran vs Romanian Per Capita Income
COMPARE
Salvadoran
Romanian
Per Capita Income
Per Capita Income Comparison
Salvadorans
Romanians
$38,858
PER CAPITA INCOME
0.5/ 100
METRIC RATING
266th/ 347
METRIC RANK
$48,445
PER CAPITA INCOME
99.5/ 100
METRIC RATING
79th/ 347
METRIC RANK
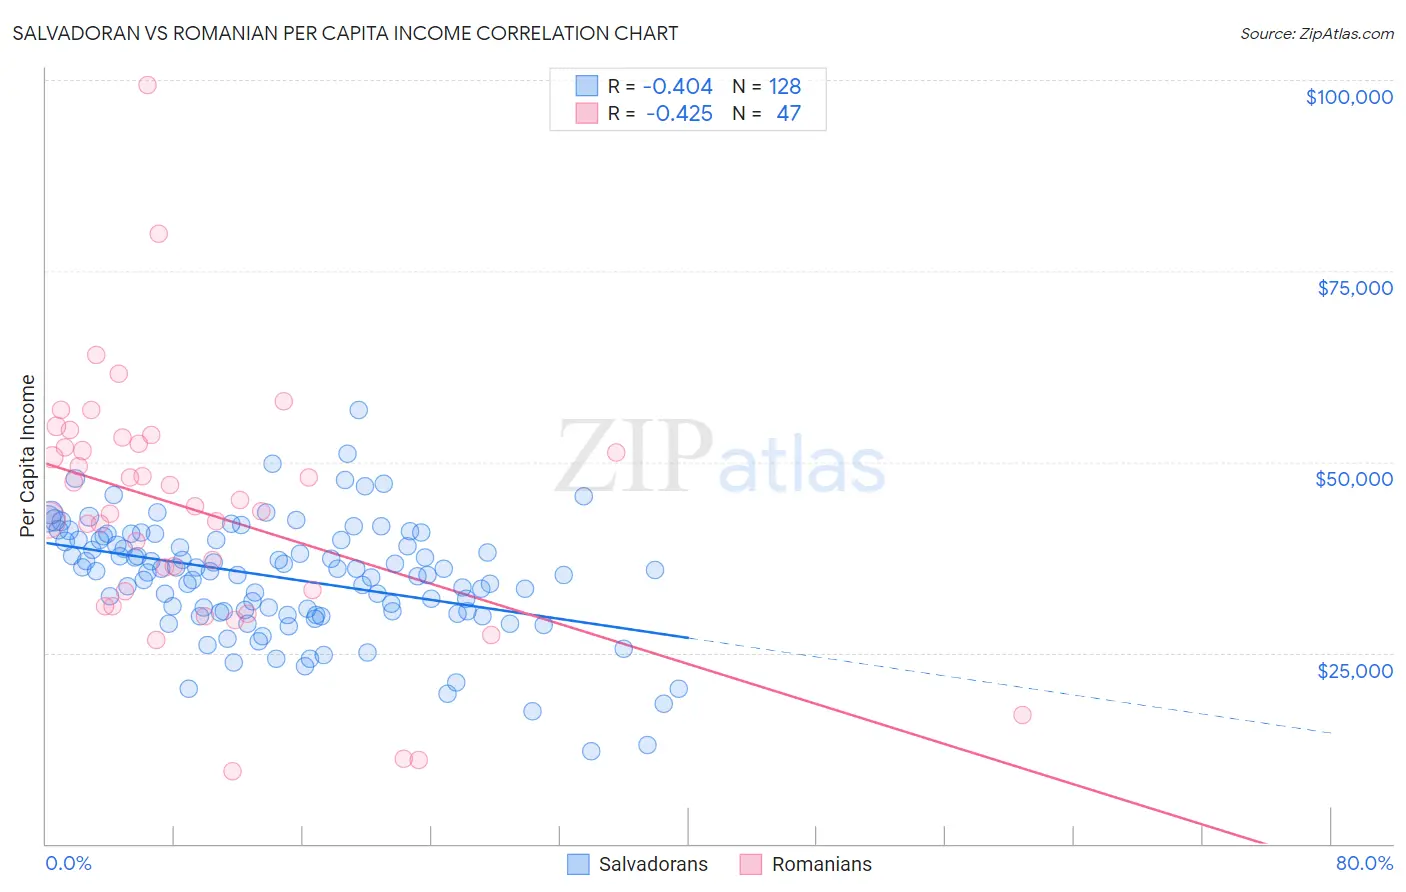
Salvadoran vs Romanian Per Capita Income Correlation Chart
The statistical analysis conducted on geographies consisting of 399,090,197 people shows a moderate negative correlation between the proportion of Salvadorans and per capita income in the United States with a correlation coefficient (R) of -0.404 and weighted average of $38,858. Similarly, the statistical analysis conducted on geographies consisting of 377,926,432 people shows a moderate negative correlation between the proportion of Romanians and per capita income in the United States with a correlation coefficient (R) of -0.425 and weighted average of $48,445, a difference of 24.7%.
Per Capita Income Correlation Summary
| Measurement | Salvadoran | Romanian |
| Minimum | $12,183 | $9,471 |
| Maximum | $56,804 | $99,396 |
| Range | $44,621 | $89,925 |
| Mean | $34,754 | $43,633 |
| Median | $35,664 | $44,159 |
| Interquartile 25% (IQ1) | $30,375 | $33,112 |
| Interquartile 75% (IQ3) | $39,784 | $52,383 |
| Interquartile Range (IQR) | $9,409 | $19,271 |
| Standard Deviation (Sample) | $7,521 | $16,424 |
| Standard Deviation (Population) | $7,492 | $16,248 |
Similar Demographics by Per Capita Income
Demographics Similar to Salvadorans by Per Capita Income
In terms of per capita income, the demographic groups most similar to Salvadorans are Immigrants from Zaire ($38,848, a difference of 0.030%), Liberian ($38,780, a difference of 0.20%), Immigrants from Jamaica ($38,766, a difference of 0.24%), Spanish American ($39,012, a difference of 0.40%), and American ($39,039, a difference of 0.47%).
| Demographics | Rating | Rank | Per Capita Income |
| Malaysians | 0.7 /100 | #259 | Tragic $39,194 |
| Alaskan Athabascans | 0.6 /100 | #260 | Tragic $39,163 |
| Marshallese | 0.6 /100 | #261 | Tragic $39,108 |
| Iroquois | 0.6 /100 | #262 | Tragic $39,104 |
| Belizeans | 0.6 /100 | #263 | Tragic $39,097 |
| Americans | 0.6 /100 | #264 | Tragic $39,039 |
| Spanish Americans | 0.5 /100 | #265 | Tragic $39,012 |
| Salvadorans | 0.5 /100 | #266 | Tragic $38,858 |
| Immigrants | Zaire | 0.4 /100 | #267 | Tragic $38,848 |
| Liberians | 0.4 /100 | #268 | Tragic $38,780 |
| Immigrants | Jamaica | 0.4 /100 | #269 | Tragic $38,766 |
| Immigrants | Belize | 0.3 /100 | #270 | Tragic $38,614 |
| Central Americans | 0.3 /100 | #271 | Tragic $38,560 |
| Immigrants | Cabo Verde | 0.3 /100 | #272 | Tragic $38,540 |
| Nepalese | 0.3 /100 | #273 | Tragic $38,442 |
Demographics Similar to Romanians by Per Capita Income
In terms of per capita income, the demographic groups most similar to Romanians are Egyptian ($48,358, a difference of 0.18%), Armenian ($48,287, a difference of 0.33%), Immigrants from Italy ($48,654, a difference of 0.43%), Immigrants from Indonesia ($48,195, a difference of 0.52%), and Immigrants from Brazil ($48,164, a difference of 0.58%).
| Demographics | Rating | Rank | Per Capita Income |
| Immigrants | Hungary | 99.8 /100 | #72 | Exceptional $49,303 |
| Immigrants | North America | 99.8 /100 | #73 | Exceptional $49,302 |
| Mongolians | 99.8 /100 | #74 | Exceptional $49,173 |
| Immigrants | Bolivia | 99.7 /100 | #75 | Exceptional $48,970 |
| Immigrants | England | 99.7 /100 | #76 | Exceptional $48,844 |
| Immigrants | Kazakhstan | 99.7 /100 | #77 | Exceptional $48,747 |
| Immigrants | Italy | 99.6 /100 | #78 | Exceptional $48,654 |
| Romanians | 99.5 /100 | #79 | Exceptional $48,445 |
| Egyptians | 99.5 /100 | #80 | Exceptional $48,358 |
| Armenians | 99.4 /100 | #81 | Exceptional $48,287 |
| Immigrants | Indonesia | 99.4 /100 | #82 | Exceptional $48,195 |
| Immigrants | Brazil | 99.4 /100 | #83 | Exceptional $48,164 |
| Immigrants | Ukraine | 99.3 /100 | #84 | Exceptional $48,134 |
| Austrians | 99.3 /100 | #85 | Exceptional $48,116 |
| Immigrants | Southern Europe | 99.3 /100 | #86 | Exceptional $48,027 |