Salvadoran vs Romanian Disability Age Under 5
COMPARE
Salvadoran
Romanian
Disability Age Under 5
Disability Age Under 5 Comparison
Salvadorans
Romanians
1.1%
DISABILITY AGE UNDER 5
99.5/ 100
METRIC RATING
55th/ 347
METRIC RANK
1.3%
DISABILITY AGE UNDER 5
22.5/ 100
METRIC RATING
205th/ 347
METRIC RANK
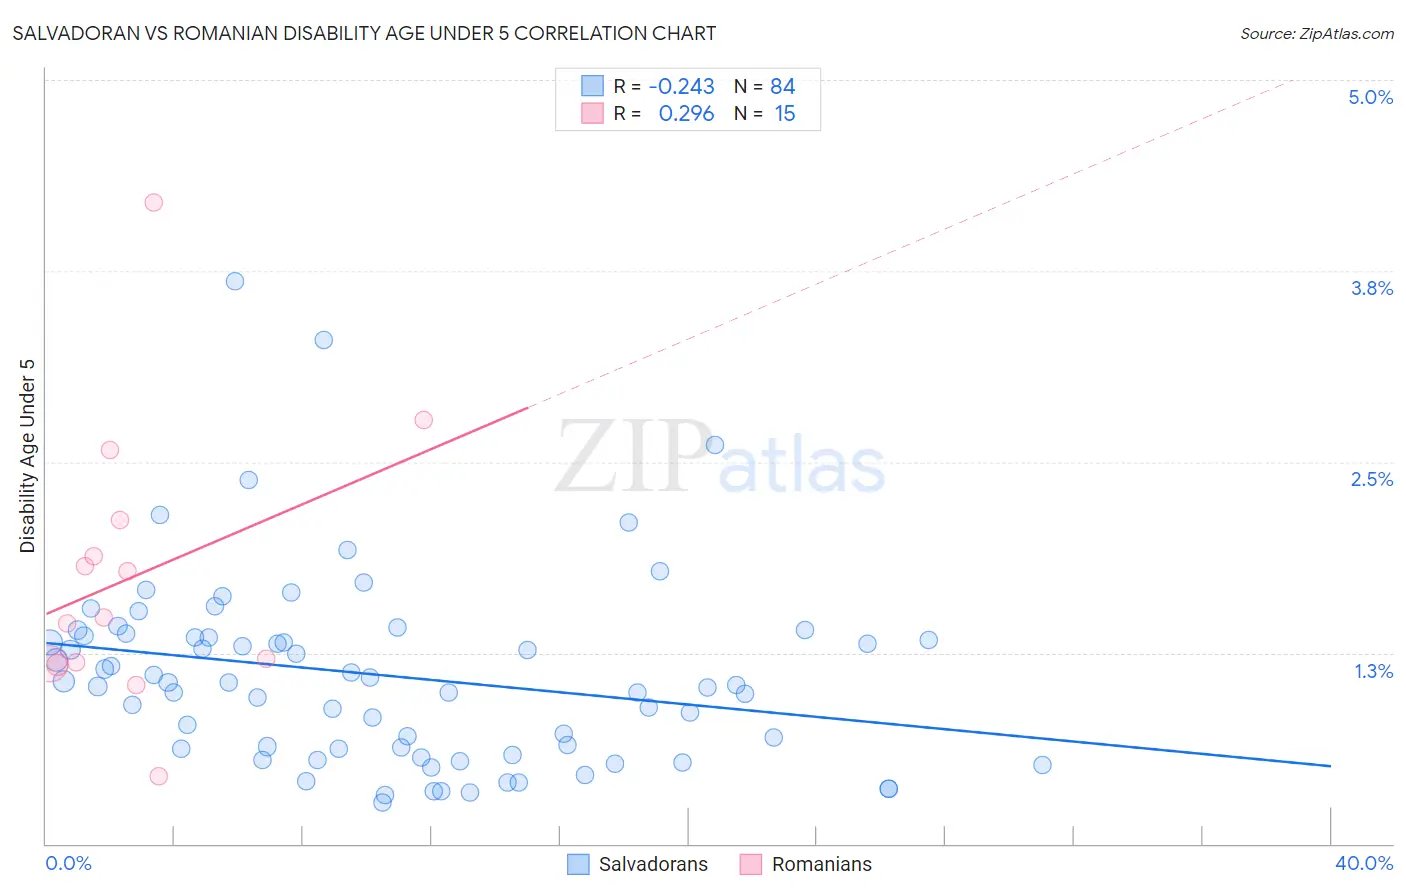
Salvadoran vs Romanian Disability Age Under 5 Correlation Chart
The statistical analysis conducted on geographies consisting of 220,785,812 people shows a weak negative correlation between the proportion of Salvadorans and percentage of population with a disability under the age of 5 in the United States with a correlation coefficient (R) of -0.243 and weighted average of 1.1%. Similarly, the statistical analysis conducted on geographies consisting of 204,318,414 people shows a weak positive correlation between the proportion of Romanians and percentage of population with a disability under the age of 5 in the United States with a correlation coefficient (R) of 0.296 and weighted average of 1.3%, a difference of 17.0%.
Disability Age Under 5 Correlation Summary
| Measurement | Salvadoran | Romanian |
| Minimum | 0.27% | 0.44% |
| Maximum | 3.7% | 4.2% |
| Range | 3.4% | 3.8% |
| Mean | 1.1% | 1.8% |
| Median | 1.0% | 1.5% |
| Interquartile 25% (IQ1) | 0.62% | 1.2% |
| Interquartile 75% (IQ3) | 1.4% | 2.1% |
| Interquartile Range (IQR) | 0.74% | 0.94% |
| Standard Deviation (Sample) | 0.63% | 0.91% |
| Standard Deviation (Population) | 0.62% | 0.88% |
Similar Demographics by Disability Age Under 5
Demographics Similar to Salvadorans by Disability Age Under 5
In terms of disability age under 5, the demographic groups most similar to Salvadorans are Immigrants from El Salvador (1.1%, a difference of 0.090%), Asian (1.1%, a difference of 0.38%), Ecuadorian (1.1%, a difference of 0.39%), Assyrian/Chaldean/Syriac (1.1%, a difference of 0.42%), and Immigrants from Egypt (1.1%, a difference of 0.61%).
| Demographics | Rating | Rank | Disability Age Under 5 |
| Immigrants | Singapore | 99.7 /100 | #48 | Exceptional 1.1% |
| Immigrants | Russia | 99.7 /100 | #49 | Exceptional 1.1% |
| Immigrants | Japan | 99.7 /100 | #50 | Exceptional 1.1% |
| Immigrants | Kazakhstan | 99.7 /100 | #51 | Exceptional 1.1% |
| Immigrants | Bolivia | 99.6 /100 | #52 | Exceptional 1.1% |
| Asians | 99.6 /100 | #53 | Exceptional 1.1% |
| Immigrants | El Salvador | 99.6 /100 | #54 | Exceptional 1.1% |
| Salvadorans | 99.5 /100 | #55 | Exceptional 1.1% |
| Ecuadorians | 99.5 /100 | #56 | Exceptional 1.1% |
| Assyrians/Chaldeans/Syriacs | 99.5 /100 | #57 | Exceptional 1.1% |
| Immigrants | Egypt | 99.4 /100 | #58 | Exceptional 1.1% |
| Immigrants | Malaysia | 99.4 /100 | #59 | Exceptional 1.1% |
| Immigrants | Western Asia | 99.2 /100 | #60 | Exceptional 1.1% |
| Immigrants | Ethiopia | 99.2 /100 | #61 | Exceptional 1.1% |
| Immigrants | Switzerland | 99.2 /100 | #62 | Exceptional 1.1% |
Demographics Similar to Romanians by Disability Age Under 5
In terms of disability age under 5, the demographic groups most similar to Romanians are Immigrants from Poland (1.3%, a difference of 0.020%), Immigrants from Europe (1.3%, a difference of 0.14%), Nigerian (1.3%, a difference of 0.17%), Liberian (1.3%, a difference of 0.18%), and Arapaho (1.3%, a difference of 0.20%).
| Demographics | Rating | Rank | Disability Age Under 5 |
| Immigrants | Norway | 31.1 /100 | #198 | Fair 1.3% |
| Jamaicans | 30.7 /100 | #199 | Fair 1.3% |
| Immigrants | Lithuania | 27.2 /100 | #200 | Fair 1.3% |
| Immigrants | Italy | 25.4 /100 | #201 | Fair 1.3% |
| Arapaho | 24.1 /100 | #202 | Fair 1.3% |
| Liberians | 24.0 /100 | #203 | Fair 1.3% |
| Immigrants | Europe | 23.6 /100 | #204 | Fair 1.3% |
| Romanians | 22.5 /100 | #205 | Fair 1.3% |
| Immigrants | Poland | 22.4 /100 | #206 | Fair 1.3% |
| Nigerians | 21.2 /100 | #207 | Fair 1.3% |
| Mexicans | 20.8 /100 | #208 | Fair 1.3% |
| Bulgarians | 19.5 /100 | #209 | Poor 1.3% |
| Pakistanis | 19.4 /100 | #210 | Poor 1.3% |
| Immigrants | Greece | 19.1 /100 | #211 | Poor 1.3% |
| Chileans | 18.8 /100 | #212 | Poor 1.3% |