Tsimshian vs Romanian Per Capita Income
COMPARE
Tsimshian
Romanian
Per Capita Income
Per Capita Income Comparison
Tsimshian
Romanians
$40,344
PER CAPITA INCOME
2.4/ 100
METRIC RATING
239th/ 347
METRIC RANK
$48,445
PER CAPITA INCOME
99.5/ 100
METRIC RATING
79th/ 347
METRIC RANK
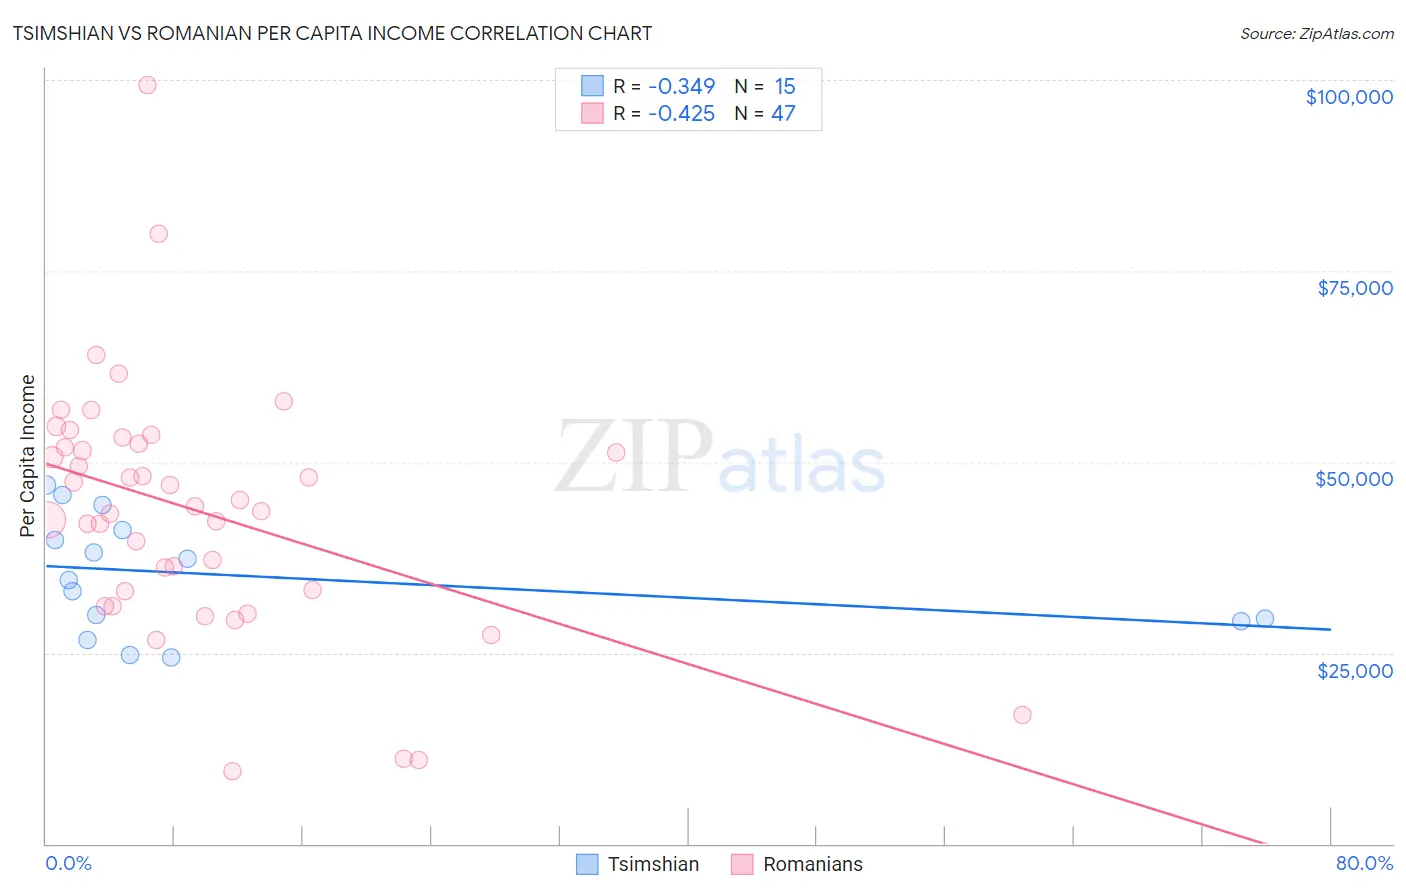
Tsimshian vs Romanian Per Capita Income Correlation Chart
The statistical analysis conducted on geographies consisting of 15,626,544 people shows a mild negative correlation between the proportion of Tsimshian and per capita income in the United States with a correlation coefficient (R) of -0.349 and weighted average of $40,344. Similarly, the statistical analysis conducted on geographies consisting of 377,926,432 people shows a moderate negative correlation between the proportion of Romanians and per capita income in the United States with a correlation coefficient (R) of -0.425 and weighted average of $48,445, a difference of 20.1%.
Per Capita Income Correlation Summary
| Measurement | Tsimshian | Romanian |
| Minimum | $24,381 | $9,471 |
| Maximum | $46,938 | $99,396 |
| Range | $22,557 | $89,925 |
| Mean | $35,015 | $43,633 |
| Median | $34,603 | $44,159 |
| Interquartile 25% (IQ1) | $29,100 | $33,112 |
| Interquartile 75% (IQ3) | $41,057 | $52,383 |
| Interquartile Range (IQR) | $11,957 | $19,271 |
| Standard Deviation (Sample) | $7,569 | $16,424 |
| Standard Deviation (Population) | $7,313 | $16,248 |
Similar Demographics by Per Capita Income
Demographics Similar to Tsimshian by Per Capita Income
In terms of per capita income, the demographic groups most similar to Tsimshian are Immigrants from Nigeria ($40,339, a difference of 0.010%), British West Indian ($40,330, a difference of 0.040%), Somali ($40,367, a difference of 0.060%), Immigrants from Western Africa ($40,294, a difference of 0.12%), and German Russian ($40,266, a difference of 0.19%).
| Demographics | Rating | Rank | Per Capita Income |
| Guyanese | 4.5 /100 | #232 | Tragic $40,949 |
| Delaware | 3.8 /100 | #233 | Tragic $40,778 |
| Immigrants | West Indies | 3.7 /100 | #234 | Tragic $40,763 |
| Immigrants | Guyana | 3.6 /100 | #235 | Tragic $40,742 |
| Immigrants | Nonimmigrants | 3.4 /100 | #236 | Tragic $40,669 |
| Immigrants | Cambodia | 2.6 /100 | #237 | Tragic $40,434 |
| Somalis | 2.4 /100 | #238 | Tragic $40,367 |
| Tsimshian | 2.4 /100 | #239 | Tragic $40,344 |
| Immigrants | Nigeria | 2.3 /100 | #240 | Tragic $40,339 |
| British West Indians | 2.3 /100 | #241 | Tragic $40,330 |
| Immigrants | Western Africa | 2.2 /100 | #242 | Tragic $40,294 |
| German Russians | 2.2 /100 | #243 | Tragic $40,266 |
| French American Indians | 2.1 /100 | #244 | Tragic $40,244 |
| Sub-Saharan Africans | 1.9 /100 | #245 | Tragic $40,152 |
| Cree | 1.7 /100 | #246 | Tragic $40,056 |
Demographics Similar to Romanians by Per Capita Income
In terms of per capita income, the demographic groups most similar to Romanians are Egyptian ($48,358, a difference of 0.18%), Armenian ($48,287, a difference of 0.33%), Immigrants from Italy ($48,654, a difference of 0.43%), Immigrants from Indonesia ($48,195, a difference of 0.52%), and Immigrants from Brazil ($48,164, a difference of 0.58%).
| Demographics | Rating | Rank | Per Capita Income |
| Immigrants | Hungary | 99.8 /100 | #72 | Exceptional $49,303 |
| Immigrants | North America | 99.8 /100 | #73 | Exceptional $49,302 |
| Mongolians | 99.8 /100 | #74 | Exceptional $49,173 |
| Immigrants | Bolivia | 99.7 /100 | #75 | Exceptional $48,970 |
| Immigrants | England | 99.7 /100 | #76 | Exceptional $48,844 |
| Immigrants | Kazakhstan | 99.7 /100 | #77 | Exceptional $48,747 |
| Immigrants | Italy | 99.6 /100 | #78 | Exceptional $48,654 |
| Romanians | 99.5 /100 | #79 | Exceptional $48,445 |
| Egyptians | 99.5 /100 | #80 | Exceptional $48,358 |
| Armenians | 99.4 /100 | #81 | Exceptional $48,287 |
| Immigrants | Indonesia | 99.4 /100 | #82 | Exceptional $48,195 |
| Immigrants | Brazil | 99.4 /100 | #83 | Exceptional $48,164 |
| Immigrants | Ukraine | 99.3 /100 | #84 | Exceptional $48,134 |
| Austrians | 99.3 /100 | #85 | Exceptional $48,116 |
| Immigrants | Southern Europe | 99.3 /100 | #86 | Exceptional $48,027 |