Salvadoran vs Immigrants from Northern Europe Per Capita Income
COMPARE
Salvadoran
Immigrants from Northern Europe
Per Capita Income
Per Capita Income Comparison
Salvadorans
Immigrants from Northern Europe
$38,858
PER CAPITA INCOME
0.5/ 100
METRIC RATING
266th/ 347
METRIC RANK
$54,159
PER CAPITA INCOME
100.0/ 100
METRIC RATING
21st/ 347
METRIC RANK
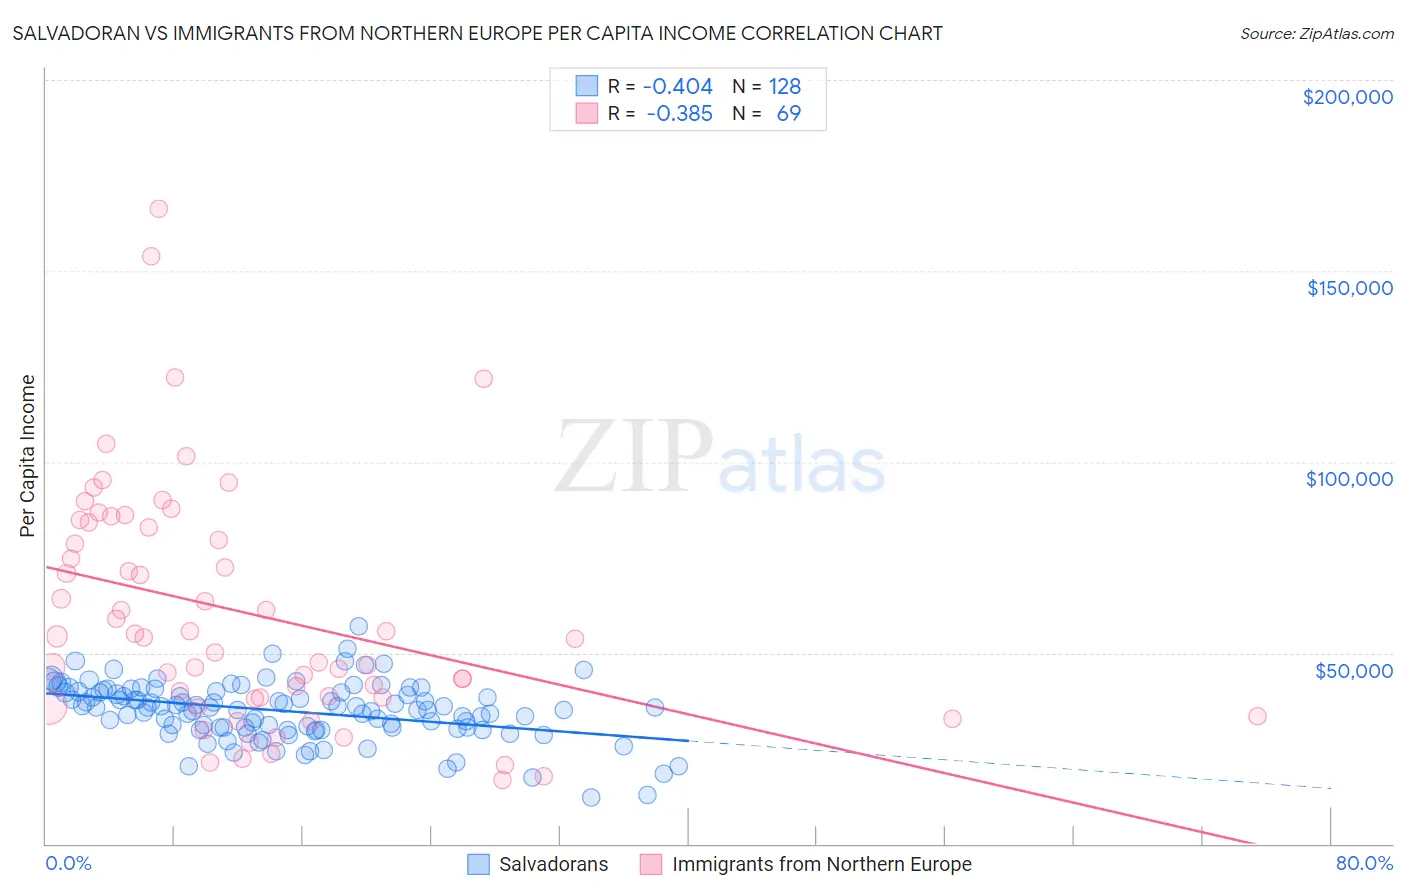
Salvadoran vs Immigrants from Northern Europe Per Capita Income Correlation Chart
The statistical analysis conducted on geographies consisting of 399,090,197 people shows a moderate negative correlation between the proportion of Salvadorans and per capita income in the United States with a correlation coefficient (R) of -0.404 and weighted average of $38,858. Similarly, the statistical analysis conducted on geographies consisting of 477,262,746 people shows a mild negative correlation between the proportion of Immigrants from Northern Europe and per capita income in the United States with a correlation coefficient (R) of -0.385 and weighted average of $54,159, a difference of 39.4%.
Per Capita Income Correlation Summary
| Measurement | Salvadoran | Immigrants from Northern Europe |
| Minimum | $12,183 | $16,541 |
| Maximum | $56,804 | $166,372 |
| Range | $44,621 | $149,831 |
| Mean | $34,754 | $60,222 |
| Median | $35,664 | $53,889 |
| Interquartile 25% (IQ1) | $30,375 | $38,162 |
| Interquartile 75% (IQ3) | $39,784 | $83,485 |
| Interquartile Range (IQR) | $9,409 | $45,324 |
| Standard Deviation (Sample) | $7,521 | $31,097 |
| Standard Deviation (Population) | $7,492 | $30,871 |
Similar Demographics by Per Capita Income
Demographics Similar to Salvadorans by Per Capita Income
In terms of per capita income, the demographic groups most similar to Salvadorans are Immigrants from Zaire ($38,848, a difference of 0.030%), Liberian ($38,780, a difference of 0.20%), Immigrants from Jamaica ($38,766, a difference of 0.24%), Spanish American ($39,012, a difference of 0.40%), and American ($39,039, a difference of 0.47%).
| Demographics | Rating | Rank | Per Capita Income |
| Malaysians | 0.7 /100 | #259 | Tragic $39,194 |
| Alaskan Athabascans | 0.6 /100 | #260 | Tragic $39,163 |
| Marshallese | 0.6 /100 | #261 | Tragic $39,108 |
| Iroquois | 0.6 /100 | #262 | Tragic $39,104 |
| Belizeans | 0.6 /100 | #263 | Tragic $39,097 |
| Americans | 0.6 /100 | #264 | Tragic $39,039 |
| Spanish Americans | 0.5 /100 | #265 | Tragic $39,012 |
| Salvadorans | 0.5 /100 | #266 | Tragic $38,858 |
| Immigrants | Zaire | 0.4 /100 | #267 | Tragic $38,848 |
| Liberians | 0.4 /100 | #268 | Tragic $38,780 |
| Immigrants | Jamaica | 0.4 /100 | #269 | Tragic $38,766 |
| Immigrants | Belize | 0.3 /100 | #270 | Tragic $38,614 |
| Central Americans | 0.3 /100 | #271 | Tragic $38,560 |
| Immigrants | Cabo Verde | 0.3 /100 | #272 | Tragic $38,540 |
| Nepalese | 0.3 /100 | #273 | Tragic $38,442 |
Demographics Similar to Immigrants from Northern Europe by Per Capita Income
In terms of per capita income, the demographic groups most similar to Immigrants from Northern Europe are Soviet Union ($54,202, a difference of 0.080%), Immigrants from China ($54,264, a difference of 0.19%), Thai ($54,307, a difference of 0.27%), Indian (Asian) ($53,874, a difference of 0.53%), and Immigrants from Eastern Asia ($53,806, a difference of 0.66%).
| Demographics | Rating | Rank | Per Capita Income |
| Immigrants | Belgium | 100.0 /100 | #14 | Exceptional $55,082 |
| Cypriots | 100.0 /100 | #15 | Exceptional $54,899 |
| Immigrants | Switzerland | 100.0 /100 | #16 | Exceptional $54,866 |
| Immigrants | France | 100.0 /100 | #17 | Exceptional $54,557 |
| Thais | 100.0 /100 | #18 | Exceptional $54,307 |
| Immigrants | China | 100.0 /100 | #19 | Exceptional $54,264 |
| Soviet Union | 100.0 /100 | #20 | Exceptional $54,202 |
| Immigrants | Northern Europe | 100.0 /100 | #21 | Exceptional $54,159 |
| Indians (Asian) | 100.0 /100 | #22 | Exceptional $53,874 |
| Immigrants | Eastern Asia | 100.0 /100 | #23 | Exceptional $53,806 |
| Immigrants | Denmark | 100.0 /100 | #24 | Exceptional $53,799 |
| Immigrants | Japan | 100.0 /100 | #25 | Exceptional $53,359 |
| Russians | 100.0 /100 | #26 | Exceptional $53,154 |
| Immigrants | South Central Asia | 100.0 /100 | #27 | Exceptional $52,660 |
| Latvians | 100.0 /100 | #28 | Exceptional $52,649 |