Immigrants from Bangladesh vs Romanian Per Capita Income
COMPARE
Immigrants from Bangladesh
Romanian
Per Capita Income
Per Capita Income Comparison
Immigrants from Bangladesh
Romanians
$41,709
PER CAPITA INCOME
10.1/ 100
METRIC RATING
214th/ 347
METRIC RANK
$48,445
PER CAPITA INCOME
99.5/ 100
METRIC RATING
79th/ 347
METRIC RANK
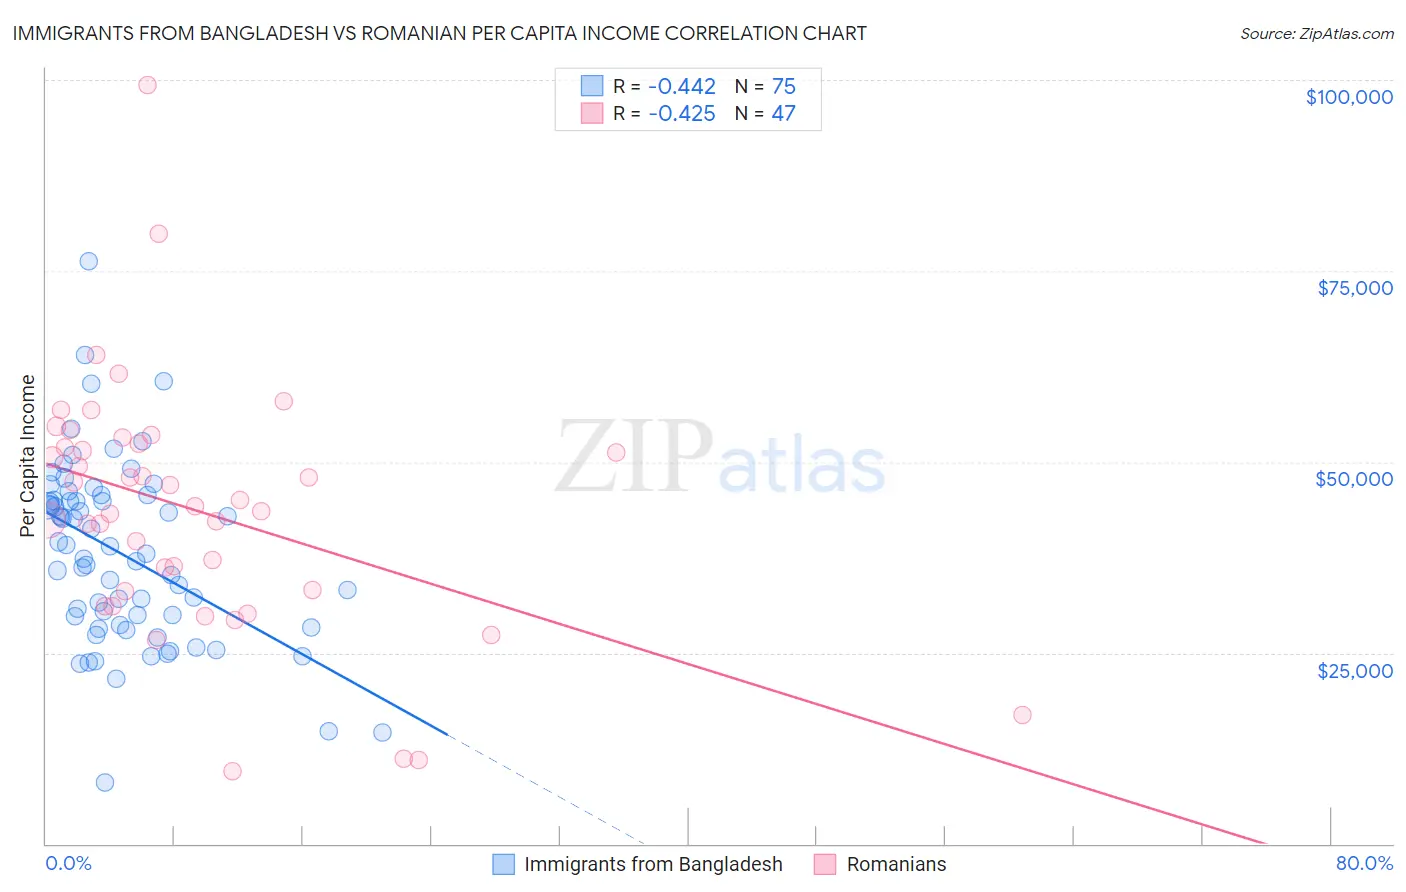
Immigrants from Bangladesh vs Romanian Per Capita Income Correlation Chart
The statistical analysis conducted on geographies consisting of 203,679,462 people shows a moderate negative correlation between the proportion of Immigrants from Bangladesh and per capita income in the United States with a correlation coefficient (R) of -0.442 and weighted average of $41,709. Similarly, the statistical analysis conducted on geographies consisting of 377,926,432 people shows a moderate negative correlation between the proportion of Romanians and per capita income in the United States with a correlation coefficient (R) of -0.425 and weighted average of $48,445, a difference of 16.2%.
Per Capita Income Correlation Summary
| Measurement | Immigrants from Bangladesh | Romanian |
| Minimum | $8,026 | $9,471 |
| Maximum | $76,210 | $99,396 |
| Range | $68,184 | $89,925 |
| Mean | $37,925 | $43,633 |
| Median | $37,941 | $44,159 |
| Interquartile 25% (IQ1) | $28,589 | $33,112 |
| Interquartile 75% (IQ3) | $44,956 | $52,383 |
| Interquartile Range (IQR) | $16,367 | $19,271 |
| Standard Deviation (Sample) | $11,865 | $16,424 |
| Standard Deviation (Population) | $11,786 | $16,248 |
Similar Demographics by Per Capita Income
Demographics Similar to Immigrants from Bangladesh by Per Capita Income
In terms of per capita income, the demographic groups most similar to Immigrants from Bangladesh are Sudanese ($41,695, a difference of 0.030%), Immigrants from Venezuela ($41,727, a difference of 0.040%), Tongan ($41,693, a difference of 0.040%), Guamanian/Chamorro ($41,678, a difference of 0.070%), and Trinidadian and Tobagonian ($41,655, a difference of 0.13%).
| Demographics | Rating | Rank | Per Capita Income |
| Venezuelans | 14.4 /100 | #207 | Poor $42,074 |
| Panamanians | 13.9 /100 | #208 | Poor $42,035 |
| Immigrants | Sudan | 13.2 /100 | #209 | Poor $41,986 |
| Ecuadorians | 12.9 /100 | #210 | Poor $41,958 |
| Immigrants | Panama | 11.6 /100 | #211 | Poor $41,853 |
| Immigrants | Senegal | 11.3 /100 | #212 | Poor $41,830 |
| Immigrants | Venezuela | 10.2 /100 | #213 | Poor $41,727 |
| Immigrants | Bangladesh | 10.1 /100 | #214 | Poor $41,709 |
| Sudanese | 9.9 /100 | #215 | Tragic $41,695 |
| Tongans | 9.9 /100 | #216 | Tragic $41,693 |
| Guamanians/Chamorros | 9.7 /100 | #217 | Tragic $41,678 |
| Trinidadians and Tobagonians | 9.5 /100 | #218 | Tragic $41,655 |
| Puget Sound Salish | 8.1 /100 | #219 | Tragic $41,495 |
| Immigrants | Barbados | 7.9 /100 | #220 | Tragic $41,478 |
| Immigrants | Trinidad and Tobago | 7.9 /100 | #221 | Tragic $41,476 |
Demographics Similar to Romanians by Per Capita Income
In terms of per capita income, the demographic groups most similar to Romanians are Egyptian ($48,358, a difference of 0.18%), Armenian ($48,287, a difference of 0.33%), Immigrants from Italy ($48,654, a difference of 0.43%), Immigrants from Indonesia ($48,195, a difference of 0.52%), and Immigrants from Brazil ($48,164, a difference of 0.58%).
| Demographics | Rating | Rank | Per Capita Income |
| Immigrants | Hungary | 99.8 /100 | #72 | Exceptional $49,303 |
| Immigrants | North America | 99.8 /100 | #73 | Exceptional $49,302 |
| Mongolians | 99.8 /100 | #74 | Exceptional $49,173 |
| Immigrants | Bolivia | 99.7 /100 | #75 | Exceptional $48,970 |
| Immigrants | England | 99.7 /100 | #76 | Exceptional $48,844 |
| Immigrants | Kazakhstan | 99.7 /100 | #77 | Exceptional $48,747 |
| Immigrants | Italy | 99.6 /100 | #78 | Exceptional $48,654 |
| Romanians | 99.5 /100 | #79 | Exceptional $48,445 |
| Egyptians | 99.5 /100 | #80 | Exceptional $48,358 |
| Armenians | 99.4 /100 | #81 | Exceptional $48,287 |
| Immigrants | Indonesia | 99.4 /100 | #82 | Exceptional $48,195 |
| Immigrants | Brazil | 99.4 /100 | #83 | Exceptional $48,164 |
| Immigrants | Ukraine | 99.3 /100 | #84 | Exceptional $48,134 |
| Austrians | 99.3 /100 | #85 | Exceptional $48,116 |
| Immigrants | Southern Europe | 99.3 /100 | #86 | Exceptional $48,027 |