Choctaw vs Romanian Per Capita Income
COMPARE
Choctaw
Romanian
Per Capita Income
Per Capita Income Comparison
Choctaw
Romanians
$35,999
PER CAPITA INCOME
0.0/ 100
METRIC RATING
316th/ 347
METRIC RANK
$48,445
PER CAPITA INCOME
99.5/ 100
METRIC RATING
79th/ 347
METRIC RANK
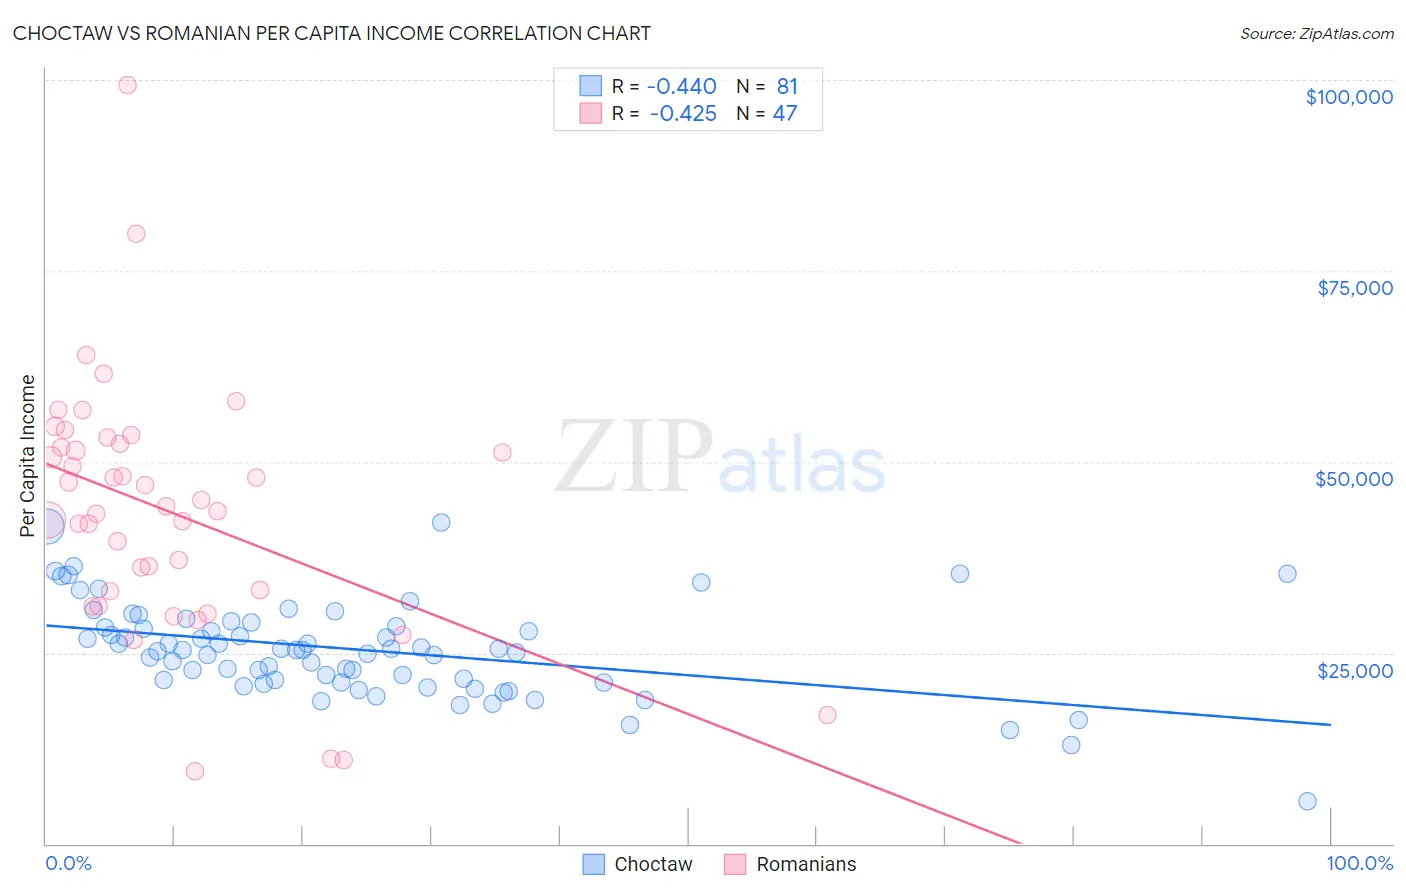
Choctaw vs Romanian Per Capita Income Correlation Chart
The statistical analysis conducted on geographies consisting of 269,743,960 people shows a moderate negative correlation between the proportion of Choctaw and per capita income in the United States with a correlation coefficient (R) of -0.440 and weighted average of $35,999. Similarly, the statistical analysis conducted on geographies consisting of 377,926,432 people shows a moderate negative correlation between the proportion of Romanians and per capita income in the United States with a correlation coefficient (R) of -0.425 and weighted average of $48,445, a difference of 34.6%.
Per Capita Income Correlation Summary
| Measurement | Choctaw | Romanian |
| Minimum | $5,606 | $9,471 |
| Maximum | $42,046 | $99,396 |
| Range | $36,440 | $89,925 |
| Mean | $25,429 | $43,633 |
| Median | $25,402 | $44,159 |
| Interquartile 25% (IQ1) | $21,238 | $33,112 |
| Interquartile 75% (IQ3) | $28,737 | $52,383 |
| Interquartile Range (IQR) | $7,499 | $19,271 |
| Standard Deviation (Sample) | $6,184 | $16,424 |
| Standard Deviation (Population) | $6,145 | $16,248 |
Similar Demographics by Per Capita Income
Demographics Similar to Choctaw by Per Capita Income
In terms of per capita income, the demographic groups most similar to Choctaw are Dutch West Indian ($35,922, a difference of 0.21%), Bangladeshi ($35,897, a difference of 0.28%), Yaqui ($36,112, a difference of 0.31%), Seminole ($36,180, a difference of 0.50%), and Immigrants from Congo ($35,720, a difference of 0.78%).
| Demographics | Rating | Rank | Per Capita Income |
| Immigrants | Honduras | 0.0 /100 | #309 | Tragic $36,665 |
| Ute | 0.0 /100 | #310 | Tragic $36,651 |
| Chippewa | 0.0 /100 | #311 | Tragic $36,631 |
| Chickasaw | 0.0 /100 | #312 | Tragic $36,475 |
| Bahamians | 0.0 /100 | #313 | Tragic $36,427 |
| Seminole | 0.0 /100 | #314 | Tragic $36,180 |
| Yaqui | 0.0 /100 | #315 | Tragic $36,112 |
| Choctaw | 0.0 /100 | #316 | Tragic $35,999 |
| Dutch West Indians | 0.0 /100 | #317 | Tragic $35,922 |
| Bangladeshis | 0.0 /100 | #318 | Tragic $35,897 |
| Immigrants | Congo | 0.0 /100 | #319 | Tragic $35,720 |
| Hispanics or Latinos | 0.0 /100 | #320 | Tragic $35,688 |
| Blacks/African Americans | 0.0 /100 | #321 | Tragic $35,564 |
| Creek | 0.0 /100 | #322 | Tragic $35,546 |
| Cheyenne | 0.0 /100 | #323 | Tragic $35,276 |
Demographics Similar to Romanians by Per Capita Income
In terms of per capita income, the demographic groups most similar to Romanians are Egyptian ($48,358, a difference of 0.18%), Armenian ($48,287, a difference of 0.33%), Immigrants from Italy ($48,654, a difference of 0.43%), Immigrants from Indonesia ($48,195, a difference of 0.52%), and Immigrants from Brazil ($48,164, a difference of 0.58%).
| Demographics | Rating | Rank | Per Capita Income |
| Immigrants | Hungary | 99.8 /100 | #72 | Exceptional $49,303 |
| Immigrants | North America | 99.8 /100 | #73 | Exceptional $49,302 |
| Mongolians | 99.8 /100 | #74 | Exceptional $49,173 |
| Immigrants | Bolivia | 99.7 /100 | #75 | Exceptional $48,970 |
| Immigrants | England | 99.7 /100 | #76 | Exceptional $48,844 |
| Immigrants | Kazakhstan | 99.7 /100 | #77 | Exceptional $48,747 |
| Immigrants | Italy | 99.6 /100 | #78 | Exceptional $48,654 |
| Romanians | 99.5 /100 | #79 | Exceptional $48,445 |
| Egyptians | 99.5 /100 | #80 | Exceptional $48,358 |
| Armenians | 99.4 /100 | #81 | Exceptional $48,287 |
| Immigrants | Indonesia | 99.4 /100 | #82 | Exceptional $48,195 |
| Immigrants | Brazil | 99.4 /100 | #83 | Exceptional $48,164 |
| Immigrants | Ukraine | 99.3 /100 | #84 | Exceptional $48,134 |
| Austrians | 99.3 /100 | #85 | Exceptional $48,116 |
| Immigrants | Southern Europe | 99.3 /100 | #86 | Exceptional $48,027 |