Immigrants from Lebanon vs American Per Capita Income
COMPARE
Immigrants from Lebanon
American
Per Capita Income
Per Capita Income Comparison
Immigrants from Lebanon
Americans
$46,938
PER CAPITA INCOME
97.5/ 100
METRIC RATING
100th/ 347
METRIC RANK
$39,039
PER CAPITA INCOME
0.6/ 100
METRIC RATING
264th/ 347
METRIC RANK
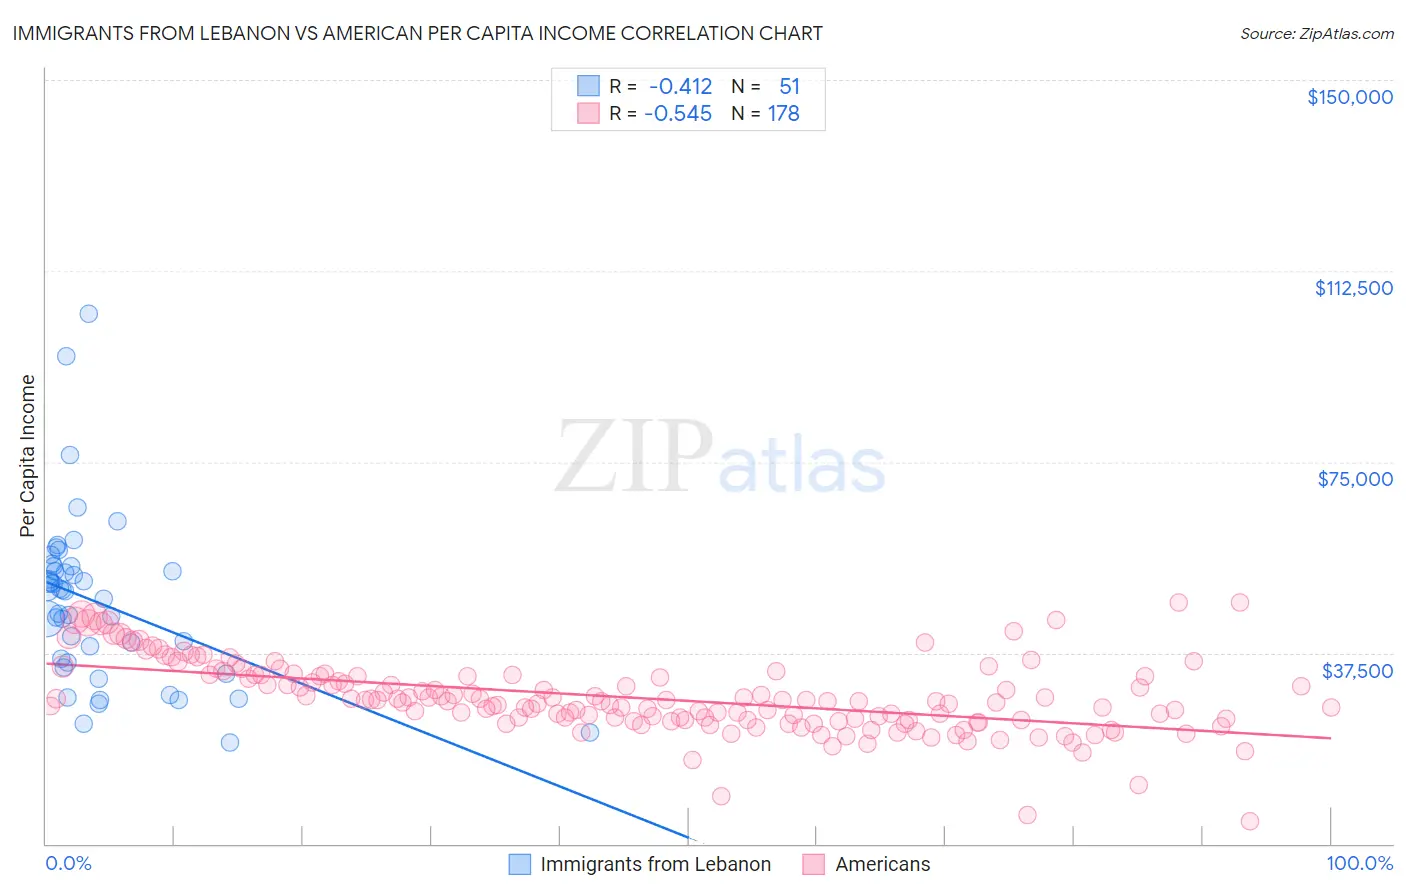
Immigrants from Lebanon vs American Per Capita Income Correlation Chart
The statistical analysis conducted on geographies consisting of 217,160,292 people shows a moderate negative correlation between the proportion of Immigrants from Lebanon and per capita income in the United States with a correlation coefficient (R) of -0.412 and weighted average of $46,938. Similarly, the statistical analysis conducted on geographies consisting of 582,039,940 people shows a substantial negative correlation between the proportion of Americans and per capita income in the United States with a correlation coefficient (R) of -0.545 and weighted average of $39,039, a difference of 20.2%.
Per Capita Income Correlation Summary
| Measurement | Immigrants from Lebanon | American |
| Minimum | $19,973 | $4,486 |
| Maximum | $104,134 | $47,414 |
| Range | $84,161 | $42,928 |
| Mean | $47,317 | $28,778 |
| Median | $49,588 | $28,107 |
| Interquartile 25% (IQ1) | $35,701 | $24,336 |
| Interquartile 75% (IQ3) | $54,451 | $33,158 |
| Interquartile Range (IQR) | $18,750 | $8,822 |
| Standard Deviation (Sample) | $16,286 | $7,186 |
| Standard Deviation (Population) | $16,125 | $7,166 |
Similar Demographics by Per Capita Income
Demographics Similar to Immigrants from Lebanon by Per Capita Income
In terms of per capita income, the demographic groups most similar to Immigrants from Lebanon are Immigrants from Uzbekistan ($46,929, a difference of 0.020%), Immigrants from Western Asia ($46,876, a difference of 0.13%), Laotian ($47,041, a difference of 0.22%), Syrian ($46,837, a difference of 0.22%), and Immigrants from Pakistan ($47,084, a difference of 0.31%).
| Demographics | Rating | Rank | Per Capita Income |
| Immigrants | Zimbabwe | 98.5 /100 | #93 | Exceptional $47,394 |
| Albanians | 98.5 /100 | #94 | Exceptional $47,379 |
| Immigrants | Egypt | 98.5 /100 | #95 | Exceptional $47,361 |
| Alsatians | 98.3 /100 | #96 | Exceptional $47,284 |
| Carpatho Rusyns | 98.2 /100 | #97 | Exceptional $47,248 |
| Immigrants | Pakistan | 97.9 /100 | #98 | Exceptional $47,084 |
| Laotians | 97.8 /100 | #99 | Exceptional $47,041 |
| Immigrants | Lebanon | 97.5 /100 | #100 | Exceptional $46,938 |
| Immigrants | Uzbekistan | 97.5 /100 | #101 | Exceptional $46,929 |
| Immigrants | Western Asia | 97.4 /100 | #102 | Exceptional $46,876 |
| Syrians | 97.2 /100 | #103 | Exceptional $46,837 |
| Brazilians | 96.8 /100 | #104 | Exceptional $46,700 |
| British | 96.3 /100 | #105 | Exceptional $46,571 |
| Ethiopians | 96.3 /100 | #106 | Exceptional $46,569 |
| Serbians | 96.2 /100 | #107 | Exceptional $46,551 |
Demographics Similar to Americans by Per Capita Income
In terms of per capita income, the demographic groups most similar to Americans are Spanish American ($39,012, a difference of 0.070%), Belizean ($39,097, a difference of 0.15%), Iroquois ($39,104, a difference of 0.16%), Marshallese ($39,108, a difference of 0.17%), and Alaskan Athabascan ($39,163, a difference of 0.32%).
| Demographics | Rating | Rank | Per Capita Income |
| Nicaraguans | 0.8 /100 | #257 | Tragic $39,372 |
| Jamaicans | 0.7 /100 | #258 | Tragic $39,231 |
| Malaysians | 0.7 /100 | #259 | Tragic $39,194 |
| Alaskan Athabascans | 0.6 /100 | #260 | Tragic $39,163 |
| Marshallese | 0.6 /100 | #261 | Tragic $39,108 |
| Iroquois | 0.6 /100 | #262 | Tragic $39,104 |
| Belizeans | 0.6 /100 | #263 | Tragic $39,097 |
| Americans | 0.6 /100 | #264 | Tragic $39,039 |
| Spanish Americans | 0.5 /100 | #265 | Tragic $39,012 |
| Salvadorans | 0.5 /100 | #266 | Tragic $38,858 |
| Immigrants | Zaire | 0.4 /100 | #267 | Tragic $38,848 |
| Liberians | 0.4 /100 | #268 | Tragic $38,780 |
| Immigrants | Jamaica | 0.4 /100 | #269 | Tragic $38,766 |
| Immigrants | Belize | 0.3 /100 | #270 | Tragic $38,614 |
| Central Americans | 0.3 /100 | #271 | Tragic $38,560 |