Immigrants from South America vs Immigrants from Kenya Median Earnings
COMPARE
Immigrants from South America
Immigrants from Kenya
Median Earnings
Median Earnings Comparison
Immigrants from South America
Immigrants from Kenya
$46,548
MEDIAN EARNINGS
54.0/ 100
METRIC RATING
169th/ 347
METRIC RANK
$46,214
MEDIAN EARNINGS
42.4/ 100
METRIC RATING
184th/ 347
METRIC RANK
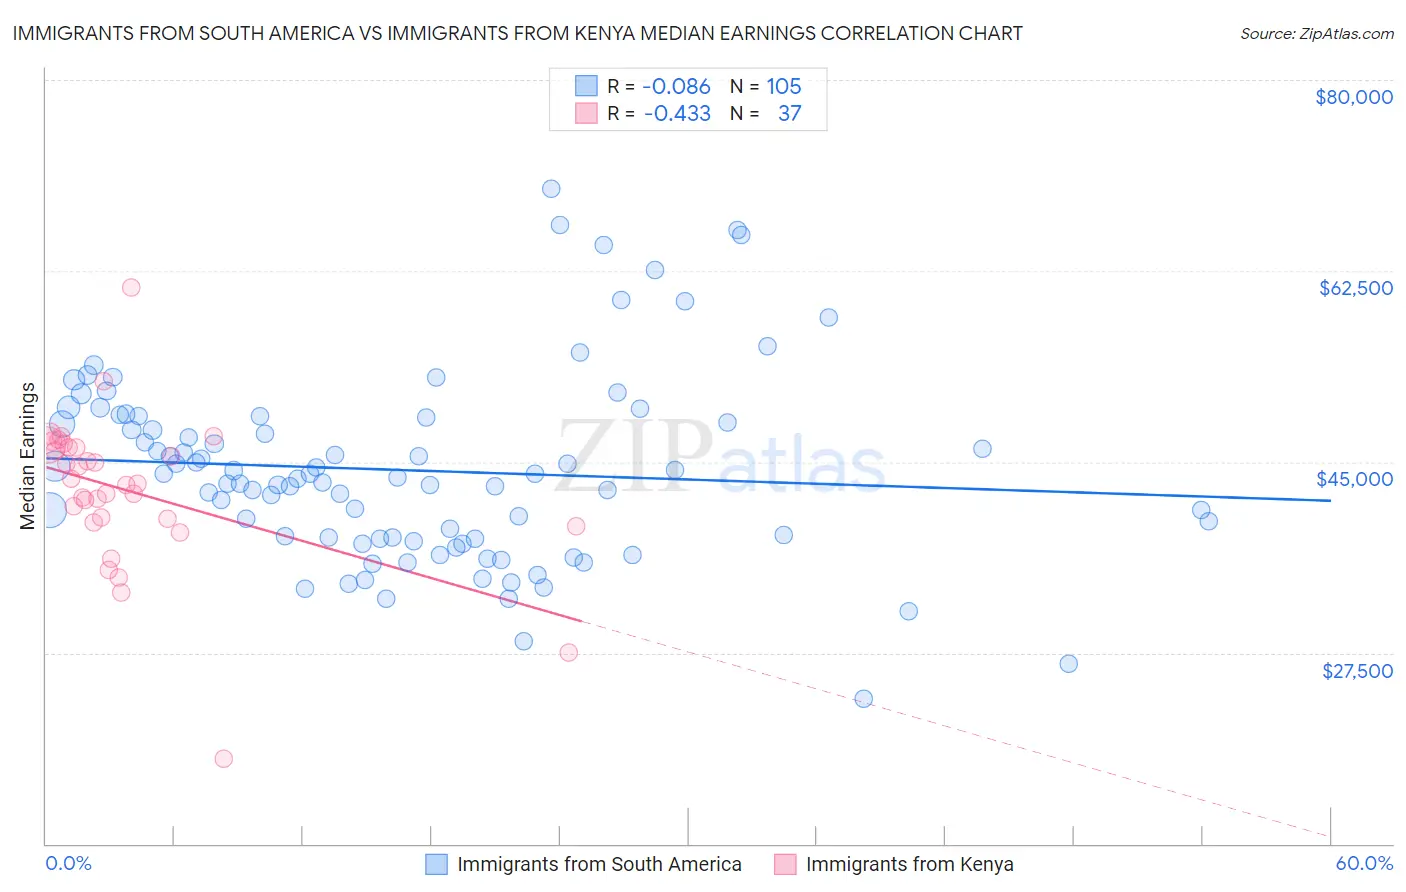
Immigrants from South America vs Immigrants from Kenya Median Earnings Correlation Chart
The statistical analysis conducted on geographies consisting of 486,376,304 people shows a slight negative correlation between the proportion of Immigrants from South America and median earnings in the United States with a correlation coefficient (R) of -0.086 and weighted average of $46,548. Similarly, the statistical analysis conducted on geographies consisting of 218,063,953 people shows a moderate negative correlation between the proportion of Immigrants from Kenya and median earnings in the United States with a correlation coefficient (R) of -0.433 and weighted average of $46,214, a difference of 0.72%.
Median Earnings Correlation Summary
| Measurement | Immigrants from South America | Immigrants from Kenya |
| Minimum | $23,314 | $17,794 |
| Maximum | $70,000 | $60,938 |
| Range | $46,686 | $43,144 |
| Mean | $44,228 | $42,338 |
| Median | $43,615 | $42,995 |
| Interquartile 25% (IQ1) | $37,956 | $39,646 |
| Interquartile 75% (IQ3) | $49,134 | $46,440 |
| Interquartile Range (IQR) | $11,178 | $6,794 |
| Standard Deviation (Sample) | $8,760 | $7,069 |
| Standard Deviation (Population) | $8,718 | $6,973 |
Demographics Similar to Immigrants from South America and Immigrants from Kenya by Median Earnings
In terms of median earnings, the demographic groups most similar to Immigrants from South America are Immigrants from Africa ($46,564, a difference of 0.030%), Immigrants ($46,478, a difference of 0.15%), Scottish ($46,463, a difference of 0.18%), Kenyan ($46,462, a difference of 0.18%), and Costa Rican ($46,645, a difference of 0.21%). Similarly, the demographic groups most similar to Immigrants from Kenya are Uruguayan ($46,190, a difference of 0.050%), Vietnamese ($46,172, a difference of 0.090%), French ($46,296, a difference of 0.18%), Swiss ($46,315, a difference of 0.22%), and Immigrants from Cameroon ($46,329, a difference of 0.25%).
| Demographics | Rating | Rank | Median Earnings |
| Czechoslovakians | 57.8 /100 | #166 | Average $46,658 |
| Costa Ricans | 57.4 /100 | #167 | Average $46,645 |
| Immigrants | Africa | 54.6 /100 | #168 | Average $46,564 |
| Immigrants | South America | 54.0 /100 | #169 | Average $46,548 |
| Immigrants | Immigrants | 51.6 /100 | #170 | Average $46,478 |
| Scottish | 51.1 /100 | #171 | Average $46,463 |
| Kenyans | 51.0 /100 | #172 | Average $46,462 |
| Ghanaians | 50.3 /100 | #173 | Average $46,440 |
| Scandinavians | 50.0 /100 | #174 | Average $46,433 |
| Basques | 48.8 /100 | #175 | Average $46,399 |
| Danes | 48.6 /100 | #176 | Average $46,392 |
| Belgians | 48.0 /100 | #177 | Average $46,375 |
| Colombians | 47.1 /100 | #178 | Average $46,349 |
| English | 46.5 /100 | #179 | Average $46,334 |
| Puget Sound Salish | 46.5 /100 | #180 | Average $46,333 |
| Immigrants | Cameroon | 46.4 /100 | #181 | Average $46,329 |
| Swiss | 45.9 /100 | #182 | Average $46,315 |
| French | 45.2 /100 | #183 | Average $46,296 |
| Immigrants | Kenya | 42.4 /100 | #184 | Average $46,214 |
| Uruguayans | 41.6 /100 | #185 | Average $46,190 |
| Vietnamese | 40.9 /100 | #186 | Average $46,172 |