Basque vs Immigrants from Kenya Median Earnings
COMPARE
Basque
Immigrants from Kenya
Median Earnings
Median Earnings Comparison
Basques
Immigrants from Kenya
$46,399
MEDIAN EARNINGS
48.8/ 100
METRIC RATING
175th/ 347
METRIC RANK
$46,214
MEDIAN EARNINGS
42.4/ 100
METRIC RATING
184th/ 347
METRIC RANK
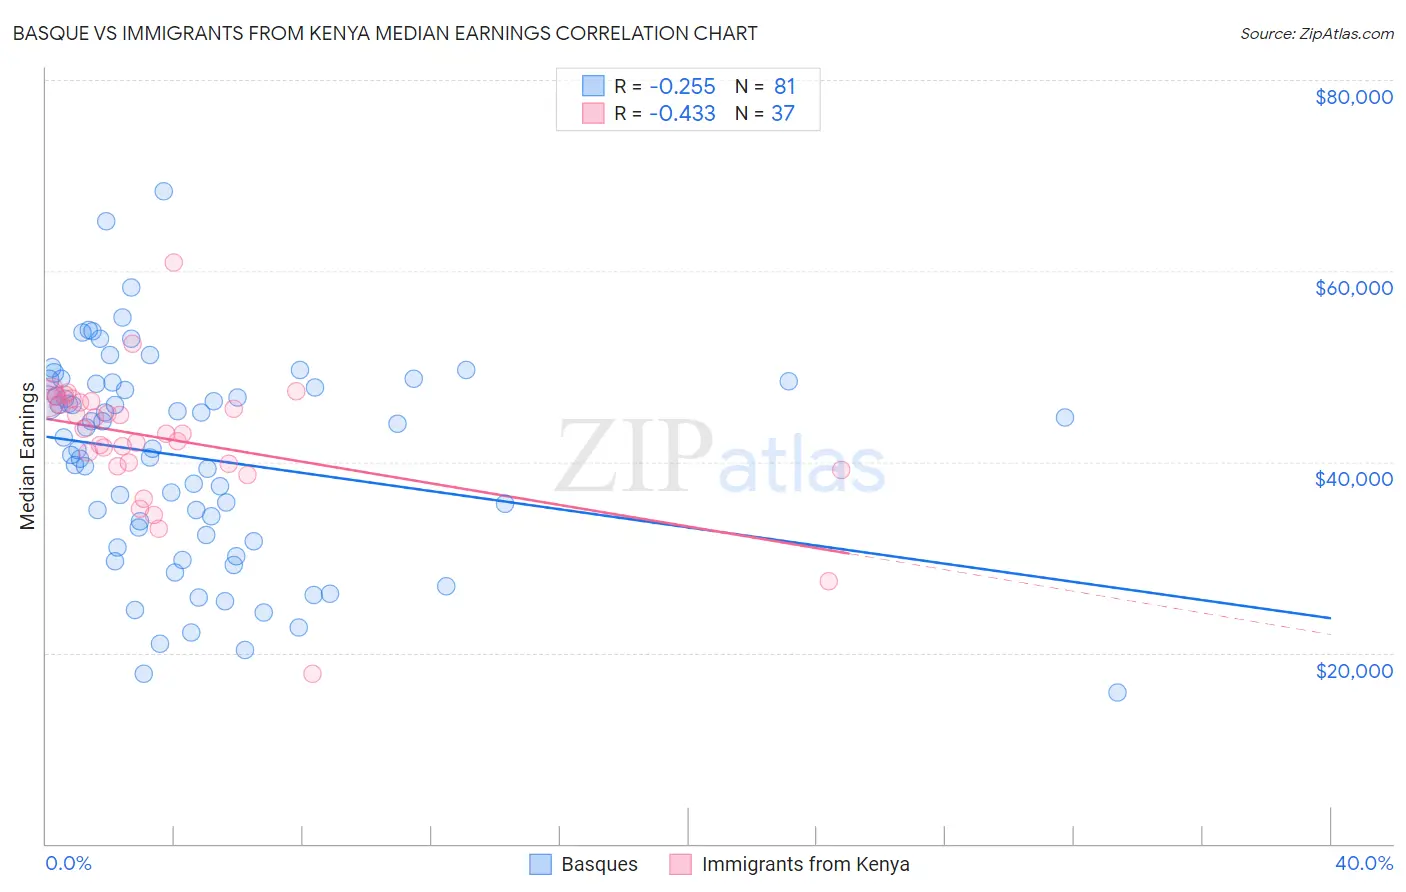
Basque vs Immigrants from Kenya Median Earnings Correlation Chart
The statistical analysis conducted on geographies consisting of 165,772,846 people shows a weak negative correlation between the proportion of Basques and median earnings in the United States with a correlation coefficient (R) of -0.255 and weighted average of $46,399. Similarly, the statistical analysis conducted on geographies consisting of 218,063,953 people shows a moderate negative correlation between the proportion of Immigrants from Kenya and median earnings in the United States with a correlation coefficient (R) of -0.433 and weighted average of $46,214, a difference of 0.40%.
Median Earnings Correlation Summary
| Measurement | Basque | Immigrants from Kenya |
| Minimum | $15,833 | $17,794 |
| Maximum | $68,304 | $60,938 |
| Range | $52,471 | $43,144 |
| Mean | $40,382 | $42,338 |
| Median | $42,566 | $42,995 |
| Interquartile 25% (IQ1) | $32,007 | $39,646 |
| Interquartile 75% (IQ3) | $48,221 | $46,440 |
| Interquartile Range (IQR) | $16,214 | $6,794 |
| Standard Deviation (Sample) | $10,903 | $7,069 |
| Standard Deviation (Population) | $10,835 | $6,973 |
Demographics Similar to Basques and Immigrants from Kenya by Median Earnings
In terms of median earnings, the demographic groups most similar to Basques are Danish ($46,392, a difference of 0.020%), Belgian ($46,375, a difference of 0.050%), Scandinavian ($46,433, a difference of 0.070%), Ghanaian ($46,440, a difference of 0.090%), and Colombian ($46,349, a difference of 0.11%). Similarly, the demographic groups most similar to Immigrants from Kenya are Uruguayan ($46,190, a difference of 0.050%), Vietnamese ($46,172, a difference of 0.090%), Iraqi ($46,140, a difference of 0.16%), French ($46,296, a difference of 0.18%), and Swiss ($46,315, a difference of 0.22%).
| Demographics | Rating | Rank | Median Earnings |
| Immigrants | South America | 54.0 /100 | #169 | Average $46,548 |
| Immigrants | Immigrants | 51.6 /100 | #170 | Average $46,478 |
| Scottish | 51.1 /100 | #171 | Average $46,463 |
| Kenyans | 51.0 /100 | #172 | Average $46,462 |
| Ghanaians | 50.3 /100 | #173 | Average $46,440 |
| Scandinavians | 50.0 /100 | #174 | Average $46,433 |
| Basques | 48.8 /100 | #175 | Average $46,399 |
| Danes | 48.6 /100 | #176 | Average $46,392 |
| Belgians | 48.0 /100 | #177 | Average $46,375 |
| Colombians | 47.1 /100 | #178 | Average $46,349 |
| English | 46.5 /100 | #179 | Average $46,334 |
| Puget Sound Salish | 46.5 /100 | #180 | Average $46,333 |
| Immigrants | Cameroon | 46.4 /100 | #181 | Average $46,329 |
| Swiss | 45.9 /100 | #182 | Average $46,315 |
| French | 45.2 /100 | #183 | Average $46,296 |
| Immigrants | Kenya | 42.4 /100 | #184 | Average $46,214 |
| Uruguayans | 41.6 /100 | #185 | Average $46,190 |
| Vietnamese | 40.9 /100 | #186 | Average $46,172 |
| Iraqis | 39.9 /100 | #187 | Fair $46,140 |
| Immigrants | Armenia | 38.3 /100 | #188 | Fair $46,094 |
| Spaniards | 37.2 /100 | #189 | Fair $46,059 |