Immigrants from Moldova vs Immigrants from Kenya Median Earnings
COMPARE
Immigrants from Moldova
Immigrants from Kenya
Median Earnings
Median Earnings Comparison
Immigrants from Moldova
Immigrants from Kenya
$50,274
MEDIAN EARNINGS
99.5/ 100
METRIC RATING
82nd/ 347
METRIC RANK
$46,214
MEDIAN EARNINGS
42.4/ 100
METRIC RATING
184th/ 347
METRIC RANK
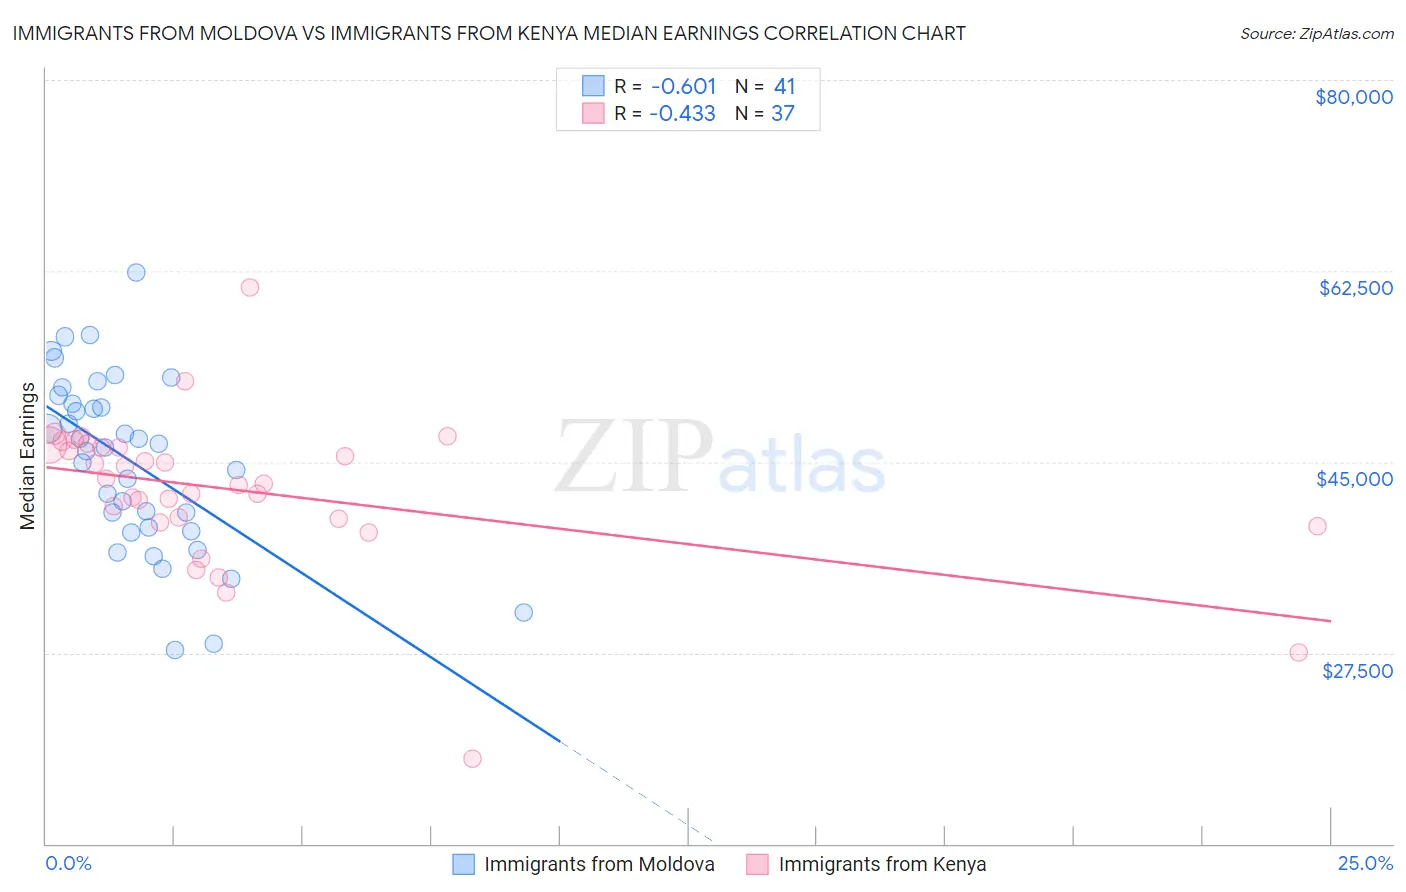
Immigrants from Moldova vs Immigrants from Kenya Median Earnings Correlation Chart
The statistical analysis conducted on geographies consisting of 124,398,835 people shows a significant negative correlation between the proportion of Immigrants from Moldova and median earnings in the United States with a correlation coefficient (R) of -0.601 and weighted average of $50,274. Similarly, the statistical analysis conducted on geographies consisting of 218,063,953 people shows a moderate negative correlation between the proportion of Immigrants from Kenya and median earnings in the United States with a correlation coefficient (R) of -0.433 and weighted average of $46,214, a difference of 8.8%.
Median Earnings Correlation Summary
| Measurement | Immigrants from Moldova | Immigrants from Kenya |
| Minimum | $27,768 | $17,794 |
| Maximum | $62,360 | $60,938 |
| Range | $34,592 | $43,144 |
| Mean | $44,970 | $42,338 |
| Median | $46,266 | $42,995 |
| Interquartile 25% (IQ1) | $38,796 | $39,646 |
| Interquartile 75% (IQ3) | $50,724 | $46,440 |
| Interquartile Range (IQR) | $11,928 | $6,794 |
| Standard Deviation (Sample) | $7,997 | $7,069 |
| Standard Deviation (Population) | $7,899 | $6,973 |
Similar Demographics by Median Earnings
Demographics Similar to Immigrants from Moldova by Median Earnings
In terms of median earnings, the demographic groups most similar to Immigrants from Moldova are Immigrants from Southern Europe ($50,280, a difference of 0.010%), Romanian ($50,244, a difference of 0.060%), Ukrainian ($50,320, a difference of 0.090%), Immigrants from Hungary ($50,227, a difference of 0.090%), and Immigrants from Kazakhstan ($50,225, a difference of 0.10%).
| Demographics | Rating | Rank | Median Earnings |
| Immigrants | Scotland | 99.8 /100 | #75 | Exceptional $50,741 |
| Immigrants | Italy | 99.7 /100 | #76 | Exceptional $50,581 |
| Immigrants | Western Europe | 99.7 /100 | #77 | Exceptional $50,549 |
| Argentineans | 99.6 /100 | #78 | Exceptional $50,399 |
| Laotians | 99.6 /100 | #79 | Exceptional $50,343 |
| Ukrainians | 99.6 /100 | #80 | Exceptional $50,320 |
| Immigrants | Southern Europe | 99.6 /100 | #81 | Exceptional $50,280 |
| Immigrants | Moldova | 99.5 /100 | #82 | Exceptional $50,274 |
| Romanians | 99.5 /100 | #83 | Exceptional $50,244 |
| Immigrants | Hungary | 99.5 /100 | #84 | Exceptional $50,227 |
| Immigrants | Kazakhstan | 99.5 /100 | #85 | Exceptional $50,225 |
| Immigrants | Canada | 99.5 /100 | #86 | Exceptional $50,192 |
| Immigrants | Uzbekistan | 99.5 /100 | #87 | Exceptional $50,151 |
| Albanians | 99.4 /100 | #88 | Exceptional $50,116 |
| Immigrants | North America | 99.4 /100 | #89 | Exceptional $50,108 |
Demographics Similar to Immigrants from Kenya by Median Earnings
In terms of median earnings, the demographic groups most similar to Immigrants from Kenya are Uruguayan ($46,190, a difference of 0.050%), Vietnamese ($46,172, a difference of 0.090%), Iraqi ($46,140, a difference of 0.16%), French ($46,296, a difference of 0.18%), and Swiss ($46,315, a difference of 0.22%).
| Demographics | Rating | Rank | Median Earnings |
| Belgians | 48.0 /100 | #177 | Average $46,375 |
| Colombians | 47.1 /100 | #178 | Average $46,349 |
| English | 46.5 /100 | #179 | Average $46,334 |
| Puget Sound Salish | 46.5 /100 | #180 | Average $46,333 |
| Immigrants | Cameroon | 46.4 /100 | #181 | Average $46,329 |
| Swiss | 45.9 /100 | #182 | Average $46,315 |
| French | 45.2 /100 | #183 | Average $46,296 |
| Immigrants | Kenya | 42.4 /100 | #184 | Average $46,214 |
| Uruguayans | 41.6 /100 | #185 | Average $46,190 |
| Vietnamese | 40.9 /100 | #186 | Average $46,172 |
| Iraqis | 39.9 /100 | #187 | Fair $46,140 |
| Immigrants | Armenia | 38.3 /100 | #188 | Fair $46,094 |
| Spaniards | 37.2 /100 | #189 | Fair $46,059 |
| French Canadians | 36.1 /100 | #190 | Fair $46,026 |
| Finns | 33.4 /100 | #191 | Fair $45,940 |