Russian vs Immigrants from Denmark Unemployment Among Seniors over 65 years
COMPARE
Russian
Immigrants from Denmark
Unemployment Among Seniors over 65 years
Unemployment Among Seniors over 65 years Comparison
Russians
Immigrants from Denmark
5.2%
UNEMPLOYMENT AMONG SENIORS OVER 65 YEARS
43.6/ 100
METRIC RATING
180th/ 347
METRIC RANK
5.2%
UNEMPLOYMENT AMONG SENIORS OVER 65 YEARS
31.0/ 100
METRIC RATING
191st/ 347
METRIC RANK
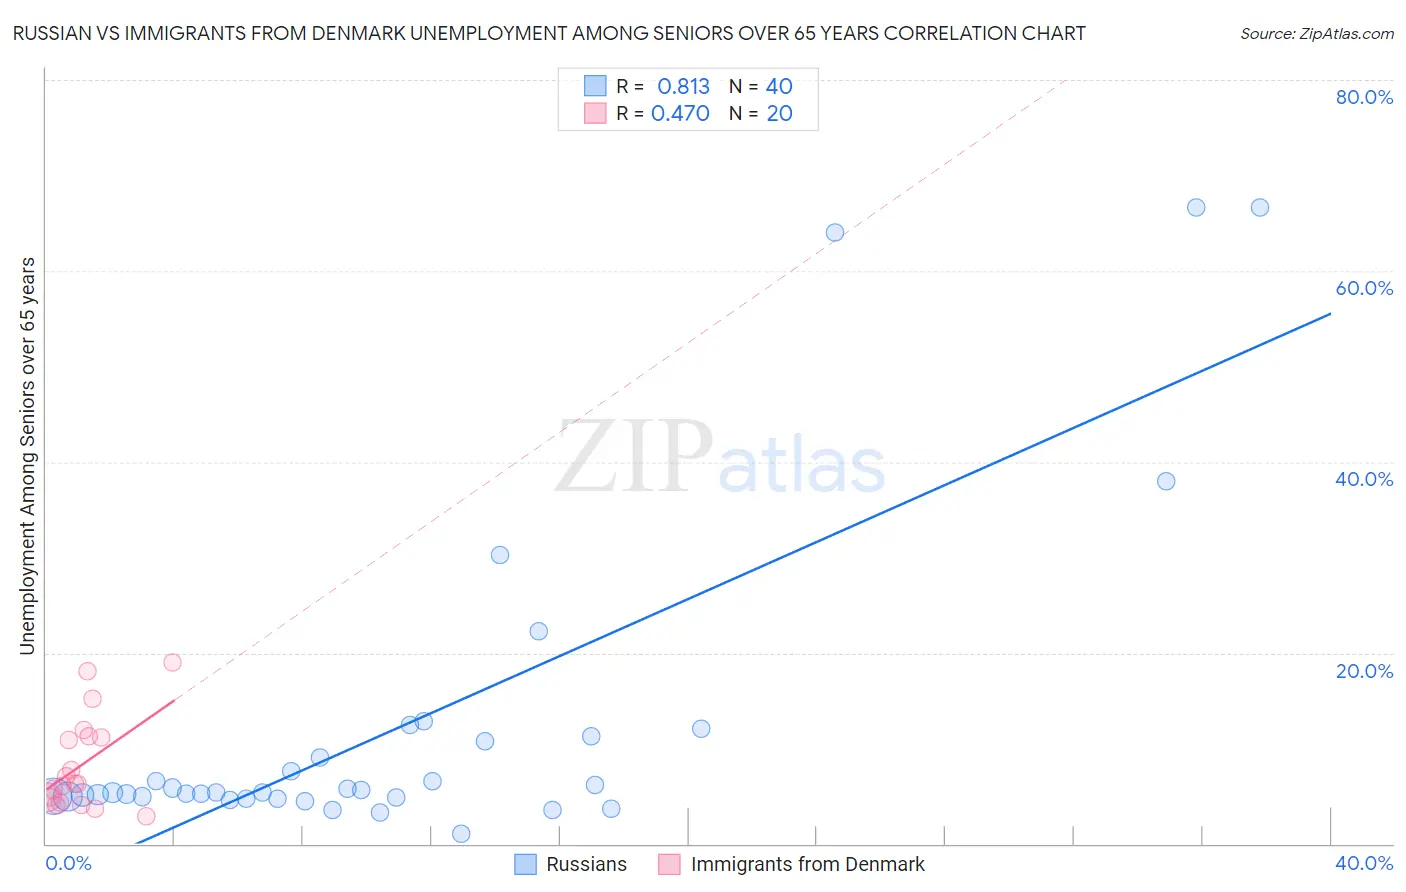
Russian vs Immigrants from Denmark Unemployment Among Seniors over 65 years Correlation Chart
The statistical analysis conducted on geographies consisting of 434,877,249 people shows a very strong positive correlation between the proportion of Russians and unemployment rate amomg seniors over the age of 65 in the United States with a correlation coefficient (R) of 0.813 and weighted average of 5.2%. Similarly, the statistical analysis conducted on geographies consisting of 130,468,759 people shows a moderate positive correlation between the proportion of Immigrants from Denmark and unemployment rate amomg seniors over the age of 65 in the United States with a correlation coefficient (R) of 0.470 and weighted average of 5.2%, a difference of 0.43%.
Unemployment Among Seniors over 65 years Correlation Summary
| Measurement | Russian | Immigrants from Denmark |
| Minimum | 1.1% | 2.9% |
| Maximum | 66.6% | 19.0% |
| Range | 65.5% | 16.1% |
| Mean | 12.4% | 8.3% |
| Median | 5.4% | 6.3% |
| Interquartile 25% (IQ1) | 4.9% | 4.6% |
| Interquartile 75% (IQ3) | 10.9% | 11.2% |
| Interquartile Range (IQR) | 6.1% | 6.5% |
| Standard Deviation (Sample) | 17.0% | 4.8% |
| Standard Deviation (Population) | 16.7% | 4.7% |
Demographics Similar to Russians and Immigrants from Denmark by Unemployment Among Seniors over 65 years
In terms of unemployment among seniors over 65 years, the demographic groups most similar to Russians are Immigrants from Italy (5.2%, a difference of 0.0%), Immigrants from Somalia (5.2%, a difference of 0.010%), Panamanian (5.2%, a difference of 0.020%), Immigrants from Belgium (5.2%, a difference of 0.040%), and Immigrants from Western Asia (5.2%, a difference of 0.050%). Similarly, the demographic groups most similar to Immigrants from Denmark are Sioux (5.2%, a difference of 0.010%), Korean (5.2%, a difference of 0.020%), Bangladeshi (5.2%, a difference of 0.050%), Immigrants from Africa (5.2%, a difference of 0.050%), and Argentinean (5.2%, a difference of 0.070%).
| Demographics | Rating | Rank | Unemployment Among Seniors over 65 years |
| Immigrants | Eastern Europe | 49.8 /100 | #175 | Average 5.1% |
| Indians (Asian) | 46.6 /100 | #176 | Average 5.2% |
| Icelanders | 45.9 /100 | #177 | Average 5.2% |
| Immigrants | Belgium | 44.8 /100 | #178 | Average 5.2% |
| Immigrants | Somalia | 44.0 /100 | #179 | Average 5.2% |
| Russians | 43.6 /100 | #180 | Average 5.2% |
| Immigrants | Italy | 43.5 /100 | #181 | Average 5.2% |
| Panamanians | 43.0 /100 | #182 | Average 5.2% |
| Immigrants | Western Asia | 42.1 /100 | #183 | Average 5.2% |
| Immigrants | Serbia | 41.6 /100 | #184 | Average 5.2% |
| Immigrants | Iran | 36.0 /100 | #185 | Fair 5.2% |
| Americans | 35.1 /100 | #186 | Fair 5.2% |
| Somalis | 33.5 /100 | #187 | Fair 5.2% |
| Immigrants | Egypt | 33.2 /100 | #188 | Fair 5.2% |
| Bangladeshis | 32.3 /100 | #189 | Fair 5.2% |
| Koreans | 31.6 /100 | #190 | Fair 5.2% |
| Immigrants | Denmark | 31.0 /100 | #191 | Fair 5.2% |
| Sioux | 30.8 /100 | #192 | Fair 5.2% |
| Immigrants | Africa | 29.6 /100 | #193 | Fair 5.2% |
| Argentineans | 29.1 /100 | #194 | Fair 5.2% |
| Costa Ricans | 27.0 /100 | #195 | Fair 5.2% |