Russian vs Immigrants from Denmark In Labor Force | Age 35-44
COMPARE
Russian
Immigrants from Denmark
In Labor Force | Age 35-44
In Labor Force | Age 35-44 Comparison
Russians
Immigrants from Denmark
85.0%
IN LABOR FORCE | AGE 35-44
99.0/ 100
METRIC RATING
71st/ 347
METRIC RANK
84.3%
IN LABOR FORCE | AGE 35-44
33.7/ 100
METRIC RATING
189th/ 347
METRIC RANK
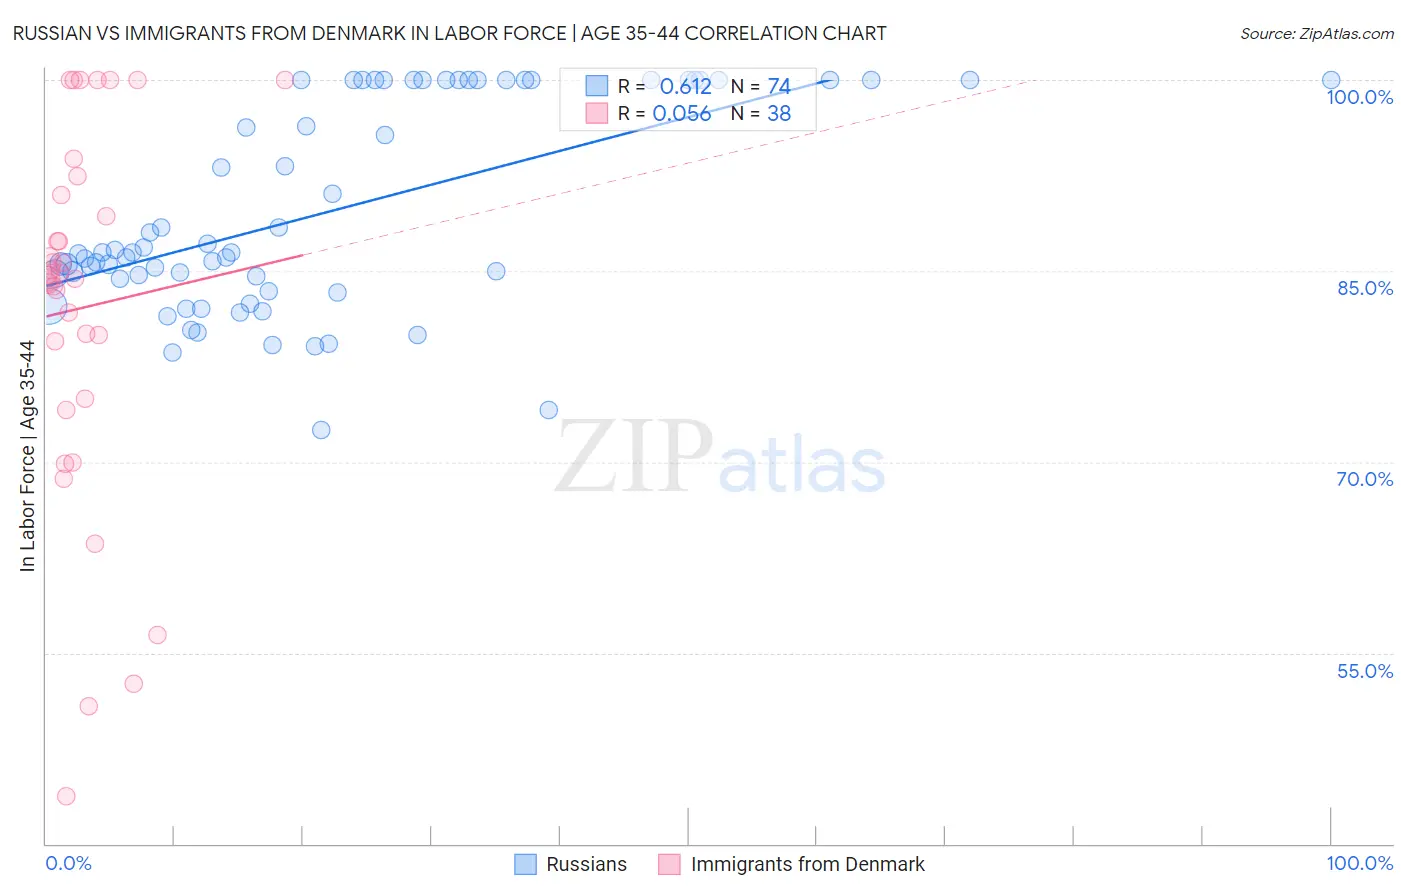
Russian vs Immigrants from Denmark In Labor Force | Age 35-44 Correlation Chart
The statistical analysis conducted on geographies consisting of 511,787,854 people shows a significant positive correlation between the proportion of Russians and labor force participation rate among population between the ages 35 and 44 in the United States with a correlation coefficient (R) of 0.612 and weighted average of 85.0%. Similarly, the statistical analysis conducted on geographies consisting of 136,414,422 people shows a slight positive correlation between the proportion of Immigrants from Denmark and labor force participation rate among population between the ages 35 and 44 in the United States with a correlation coefficient (R) of 0.056 and weighted average of 84.3%, a difference of 0.85%.
In Labor Force | Age 35-44 Correlation Summary
| Measurement | Russian | Immigrants from Denmark |
| Minimum | 72.5% | 43.7% |
| Maximum | 100.0% | 100.0% |
| Range | 27.5% | 56.3% |
| Mean | 89.6% | 82.1% |
| Median | 86.5% | 84.6% |
| Interquartile 25% (IQ1) | 84.4% | 75.0% |
| Interquartile 75% (IQ3) | 100.0% | 91.0% |
| Interquartile Range (IQR) | 15.6% | 16.0% |
| Standard Deviation (Sample) | 8.1% | 14.4% |
| Standard Deviation (Population) | 8.0% | 14.2% |
Similar Demographics by In Labor Force | Age 35-44
Demographics Similar to Russians by In Labor Force | Age 35-44
In terms of in labor force | age 35-44, the demographic groups most similar to Russians are Brazilian (85.0%, a difference of 0.0%), Sudanese (85.0%, a difference of 0.010%), Immigrants from Italy (85.0%, a difference of 0.020%), Italian (85.0%, a difference of 0.020%), and Immigrants from Singapore (85.0%, a difference of 0.020%).
| Demographics | Rating | Rank | In Labor Force | Age 35-44 |
| Swedes | 99.2 /100 | #64 | Exceptional 85.0% |
| Immigrants | Brazil | 99.2 /100 | #65 | Exceptional 85.0% |
| Immigrants | Haiti | 99.1 /100 | #66 | Exceptional 85.0% |
| Immigrants | Italy | 99.1 /100 | #67 | Exceptional 85.0% |
| Italians | 99.1 /100 | #68 | Exceptional 85.0% |
| Sudanese | 99.0 /100 | #69 | Exceptional 85.0% |
| Brazilians | 99.0 /100 | #70 | Exceptional 85.0% |
| Russians | 99.0 /100 | #71 | Exceptional 85.0% |
| Immigrants | Singapore | 98.9 /100 | #72 | Exceptional 85.0% |
| Immigrants | Sri Lanka | 98.9 /100 | #73 | Exceptional 85.0% |
| Colombians | 98.8 /100 | #74 | Exceptional 85.0% |
| Immigrants | South Central Asia | 98.7 /100 | #75 | Exceptional 85.0% |
| Immigrants | Cuba | 98.6 /100 | #76 | Exceptional 84.9% |
| Immigrants | Turkey | 98.6 /100 | #77 | Exceptional 84.9% |
| Immigrants | Africa | 98.4 /100 | #78 | Exceptional 84.9% |
Demographics Similar to Immigrants from Denmark by In Labor Force | Age 35-44
In terms of in labor force | age 35-44, the demographic groups most similar to Immigrants from Denmark are South African (84.3%, a difference of 0.0%), Armenian (84.3%, a difference of 0.010%), Costa Rican (84.3%, a difference of 0.010%), Australian (84.3%, a difference of 0.010%), and Dutch (84.3%, a difference of 0.010%).
| Demographics | Rating | Rank | In Labor Force | Age 35-44 |
| Koreans | 36.3 /100 | #182 | Fair 84.3% |
| Barbadians | 36.2 /100 | #183 | Fair 84.3% |
| Armenians | 35.6 /100 | #184 | Fair 84.3% |
| Costa Ricans | 35.3 /100 | #185 | Fair 84.3% |
| Australians | 35.1 /100 | #186 | Fair 84.3% |
| Dutch | 34.8 /100 | #187 | Fair 84.3% |
| South Africans | 34.1 /100 | #188 | Fair 84.3% |
| Immigrants | Denmark | 33.7 /100 | #189 | Fair 84.3% |
| Portuguese | 31.9 /100 | #190 | Fair 84.3% |
| Immigrants | Philippines | 27.9 /100 | #191 | Fair 84.2% |
| Immigrants | Vietnam | 27.4 /100 | #192 | Fair 84.2% |
| Hungarians | 26.8 /100 | #193 | Fair 84.2% |
| Immigrants | Indonesia | 25.7 /100 | #194 | Fair 84.2% |
| Immigrants | Caribbean | 25.7 /100 | #195 | Fair 84.2% |
| Immigrants | England | 25.0 /100 | #196 | Fair 84.2% |