Russian vs Marshallese Median Female Earnings
COMPARE
Russian
Marshallese
Median Female Earnings
Median Female Earnings Comparison
Russians
Marshallese
$44,169
MEDIAN FEMALE EARNINGS
100.0/ 100
METRIC RATING
34th/ 347
METRIC RANK
$36,459
MEDIAN FEMALE EARNINGS
0.1/ 100
METRIC RATING
277th/ 347
METRIC RANK
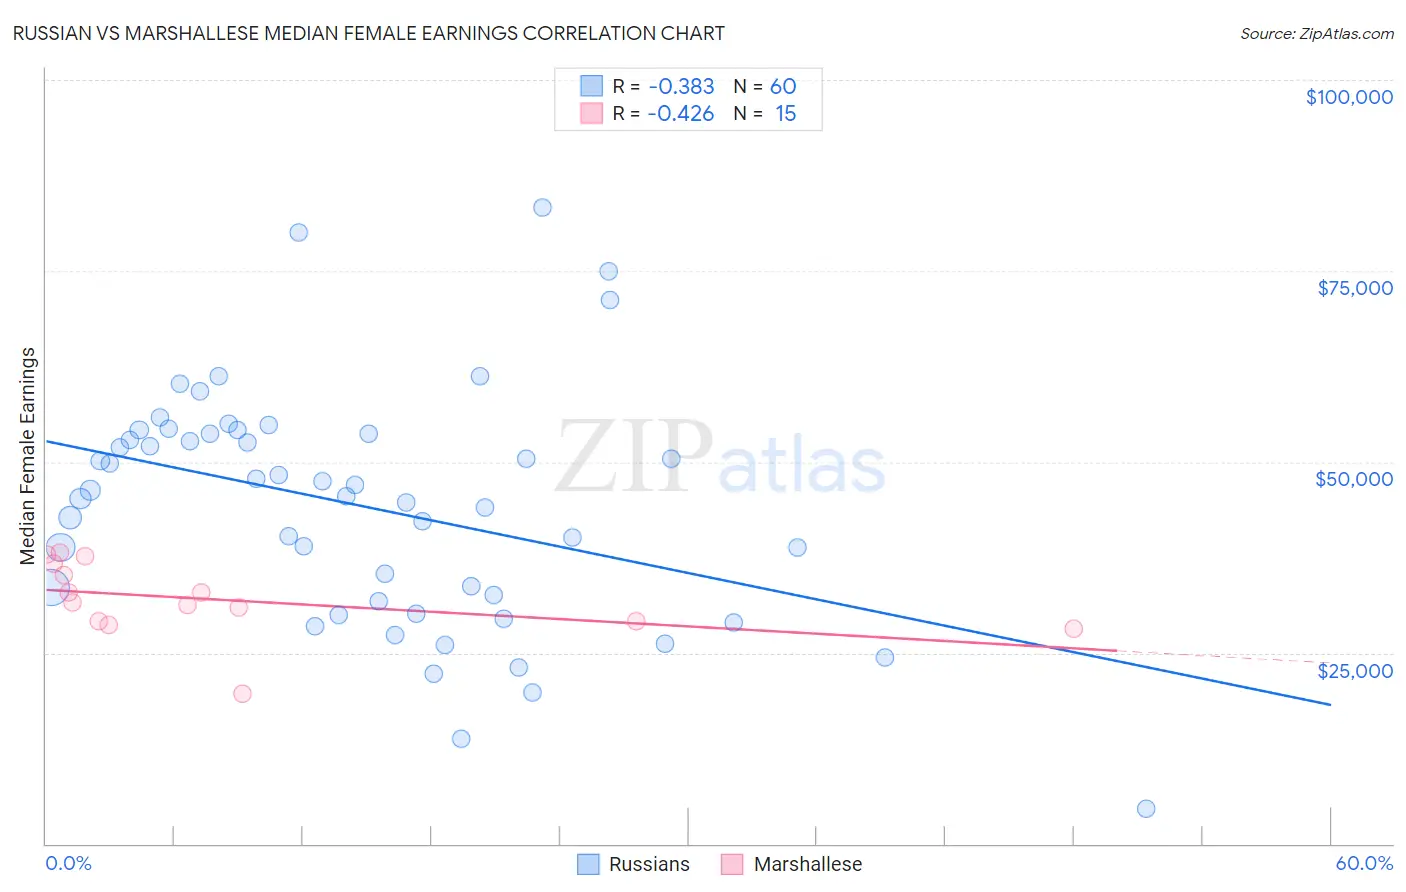
Russian vs Marshallese Median Female Earnings Correlation Chart
The statistical analysis conducted on geographies consisting of 511,592,990 people shows a mild negative correlation between the proportion of Russians and median female earnings in the United States with a correlation coefficient (R) of -0.383 and weighted average of $44,169. Similarly, the statistical analysis conducted on geographies consisting of 14,760,991 people shows a moderate negative correlation between the proportion of Marshallese and median female earnings in the United States with a correlation coefficient (R) of -0.426 and weighted average of $36,459, a difference of 21.1%.
Median Female Earnings Correlation Summary
| Measurement | Russian | Marshallese |
| Minimum | $4,625 | $19,583 |
| Maximum | $83,305 | $38,170 |
| Range | $78,680 | $18,587 |
| Mean | $44,153 | $31,981 |
| Median | $45,890 | $31,627 |
| Interquartile 25% (IQ1) | $32,157 | $29,109 |
| Interquartile 75% (IQ3) | $53,697 | $36,675 |
| Interquartile Range (IQR) | $21,540 | $7,566 |
| Standard Deviation (Sample) | $15,453 | $4,908 |
| Standard Deviation (Population) | $15,323 | $4,742 |
Similar Demographics by Median Female Earnings
Demographics Similar to Russians by Median Female Earnings
In terms of median female earnings, the demographic groups most similar to Russians are Immigrants from Sri Lanka ($44,161, a difference of 0.020%), Immigrants from Asia ($44,198, a difference of 0.070%), Immigrants from Turkey ($44,066, a difference of 0.23%), Immigrants from Switzerland ($43,996, a difference of 0.39%), and Immigrants from Northern Europe ($44,366, a difference of 0.44%).
| Demographics | Rating | Rank | Median Female Earnings |
| Turks | 100.0 /100 | #27 | Exceptional $44,695 |
| Immigrants | Russia | 100.0 /100 | #28 | Exceptional $44,680 |
| Immigrants | Belgium | 100.0 /100 | #29 | Exceptional $44,587 |
| Asians | 100.0 /100 | #30 | Exceptional $44,586 |
| Immigrants | France | 100.0 /100 | #31 | Exceptional $44,541 |
| Immigrants | Northern Europe | 100.0 /100 | #32 | Exceptional $44,366 |
| Immigrants | Asia | 100.0 /100 | #33 | Exceptional $44,198 |
| Russians | 100.0 /100 | #34 | Exceptional $44,169 |
| Immigrants | Sri Lanka | 100.0 /100 | #35 | Exceptional $44,161 |
| Immigrants | Turkey | 100.0 /100 | #36 | Exceptional $44,066 |
| Immigrants | Switzerland | 100.0 /100 | #37 | Exceptional $43,996 |
| Latvians | 100.0 /100 | #38 | Exceptional $43,941 |
| Israelis | 100.0 /100 | #39 | Exceptional $43,852 |
| Immigrants | Malaysia | 100.0 /100 | #40 | Exceptional $43,835 |
| Bhutanese | 100.0 /100 | #41 | Exceptional $43,648 |
Demographics Similar to Marshallese by Median Female Earnings
In terms of median female earnings, the demographic groups most similar to Marshallese are Central American ($36,492, a difference of 0.090%), U.S. Virgin Islander ($36,424, a difference of 0.10%), Immigrants from Caribbean ($36,414, a difference of 0.12%), Iroquois ($36,408, a difference of 0.14%), and African ($36,530, a difference of 0.19%).
| Demographics | Rating | Rank | Median Female Earnings |
| French American Indians | 0.3 /100 | #270 | Tragic $36,920 |
| Nicaraguans | 0.3 /100 | #271 | Tragic $36,904 |
| Immigrants | Dominican Republic | 0.3 /100 | #272 | Tragic $36,857 |
| Immigrants | Laos | 0.3 /100 | #273 | Tragic $36,841 |
| Immigrants | El Salvador | 0.2 /100 | #274 | Tragic $36,673 |
| Africans | 0.1 /100 | #275 | Tragic $36,530 |
| Central Americans | 0.1 /100 | #276 | Tragic $36,492 |
| Marshallese | 0.1 /100 | #277 | Tragic $36,459 |
| U.S. Virgin Islanders | 0.1 /100 | #278 | Tragic $36,424 |
| Immigrants | Caribbean | 0.1 /100 | #279 | Tragic $36,414 |
| Iroquois | 0.1 /100 | #280 | Tragic $36,408 |
| Spanish Americans | 0.1 /100 | #281 | Tragic $36,391 |
| Haitians | 0.1 /100 | #282 | Tragic $36,374 |
| Immigrants | Haiti | 0.1 /100 | #283 | Tragic $36,203 |
| Indonesians | 0.1 /100 | #284 | Tragic $36,140 |