Immigrants from Western Africa vs African Median Earnings
COMPARE
Immigrants from Western Africa
African
Median Earnings
Median Earnings Comparison
Immigrants from Western Africa
Africans
$44,893
MEDIAN EARNINGS
10.3/ 100
METRIC RATING
230th/ 347
METRIC RANK
$41,955
MEDIAN EARNINGS
0.2/ 100
METRIC RATING
282nd/ 347
METRIC RANK
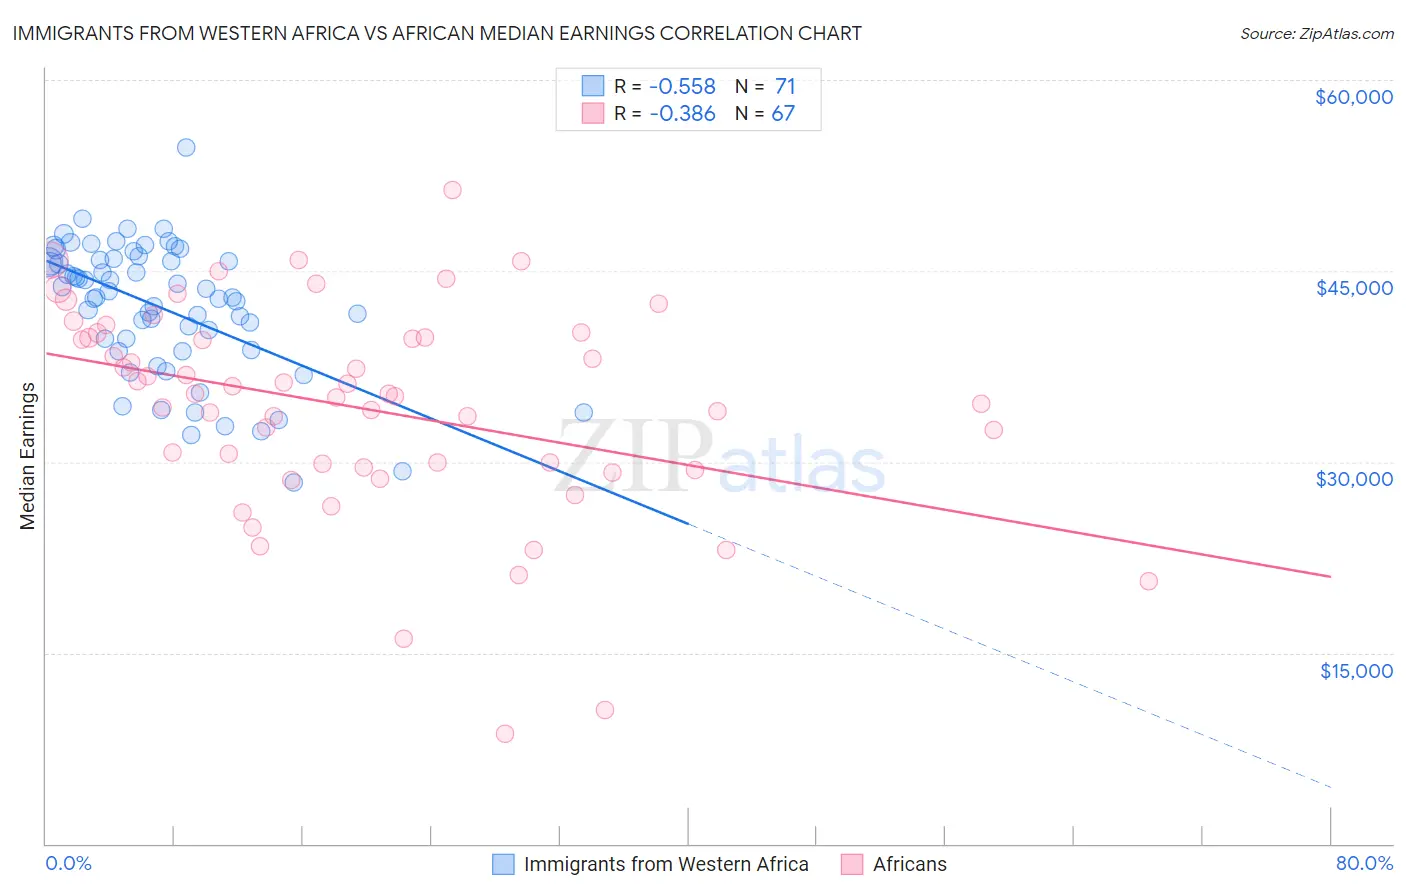
Immigrants from Western Africa vs African Median Earnings Correlation Chart
The statistical analysis conducted on geographies consisting of 357,863,895 people shows a substantial negative correlation between the proportion of Immigrants from Western Africa and median earnings in the United States with a correlation coefficient (R) of -0.558 and weighted average of $44,893. Similarly, the statistical analysis conducted on geographies consisting of 470,066,359 people shows a mild negative correlation between the proportion of Africans and median earnings in the United States with a correlation coefficient (R) of -0.386 and weighted average of $41,955, a difference of 7.0%.
Median Earnings Correlation Summary
| Measurement | Immigrants from Western Africa | African |
| Minimum | $28,358 | $8,672 |
| Maximum | $54,719 | $51,324 |
| Range | $26,361 | $42,652 |
| Mean | $42,092 | $34,249 |
| Median | $42,904 | $35,314 |
| Interquartile 25% (IQ1) | $38,801 | $29,519 |
| Interquartile 75% (IQ3) | $45,834 | $39,743 |
| Interquartile Range (IQR) | $7,033 | $10,224 |
| Standard Deviation (Sample) | $5,206 | $8,278 |
| Standard Deviation (Population) | $5,170 | $8,216 |
Similar Demographics by Median Earnings
Demographics Similar to Immigrants from Western Africa by Median Earnings
In terms of median earnings, the demographic groups most similar to Immigrants from Western Africa are Scotch-Irish ($44,924, a difference of 0.070%), Japanese ($44,825, a difference of 0.15%), Immigrants from Iraq ($44,988, a difference of 0.21%), Delaware ($44,783, a difference of 0.24%), and Immigrants from Sudan ($44,767, a difference of 0.28%).
| Demographics | Rating | Rank | Median Earnings |
| Whites/Caucasians | 15.0 /100 | #223 | Poor $45,197 |
| West Indians | 13.9 /100 | #224 | Poor $45,132 |
| Immigrants | Cambodia | 13.2 /100 | #225 | Poor $45,090 |
| Immigrants | Nigeria | 12.2 /100 | #226 | Poor $45,030 |
| Native Hawaiians | 12.2 /100 | #227 | Poor $45,027 |
| Immigrants | Iraq | 11.6 /100 | #228 | Poor $44,988 |
| Scotch-Irish | 10.7 /100 | #229 | Poor $44,924 |
| Immigrants | Western Africa | 10.3 /100 | #230 | Poor $44,893 |
| Japanese | 9.5 /100 | #231 | Tragic $44,825 |
| Delaware | 9.0 /100 | #232 | Tragic $44,783 |
| Immigrants | Sudan | 8.8 /100 | #233 | Tragic $44,767 |
| Cape Verdeans | 7.5 /100 | #234 | Tragic $44,640 |
| Venezuelans | 6.9 /100 | #235 | Tragic $44,580 |
| British West Indians | 6.7 /100 | #236 | Tragic $44,552 |
| Immigrants | Ecuador | 5.9 /100 | #237 | Tragic $44,462 |
Demographics Similar to Africans by Median Earnings
In terms of median earnings, the demographic groups most similar to Africans are Marshallese ($41,969, a difference of 0.030%), Dominican ($41,864, a difference of 0.22%), Blackfeet ($41,822, a difference of 0.32%), Hmong ($42,111, a difference of 0.37%), and Colville ($42,151, a difference of 0.47%).
| Demographics | Rating | Rank | Median Earnings |
| Immigrants | Belize | 0.3 /100 | #275 | Tragic $42,339 |
| Spanish Americans | 0.3 /100 | #276 | Tragic $42,316 |
| Central Americans | 0.3 /100 | #277 | Tragic $42,280 |
| Cajuns | 0.3 /100 | #278 | Tragic $42,189 |
| Colville | 0.2 /100 | #279 | Tragic $42,151 |
| Hmong | 0.2 /100 | #280 | Tragic $42,111 |
| Marshallese | 0.2 /100 | #281 | Tragic $41,969 |
| Africans | 0.2 /100 | #282 | Tragic $41,955 |
| Dominicans | 0.2 /100 | #283 | Tragic $41,864 |
| Blackfeet | 0.2 /100 | #284 | Tragic $41,822 |
| Immigrants | Nicaragua | 0.1 /100 | #285 | Tragic $41,737 |
| Mexican American Indians | 0.1 /100 | #286 | Tragic $41,719 |
| Indonesians | 0.1 /100 | #287 | Tragic $41,701 |
| Immigrants | Dominican Republic | 0.1 /100 | #288 | Tragic $41,554 |
| Comanche | 0.1 /100 | #289 | Tragic $41,519 |