Northern European vs Puget Sound Salish Per Capita Income
COMPARE
Northern European
Puget Sound Salish
Per Capita Income
Per Capita Income Comparison
Northern Europeans
Puget Sound Salish
$47,698
PER CAPITA INCOME
98.9/ 100
METRIC RATING
89th/ 347
METRIC RANK
$41,495
PER CAPITA INCOME
8.1/ 100
METRIC RATING
219th/ 347
METRIC RANK
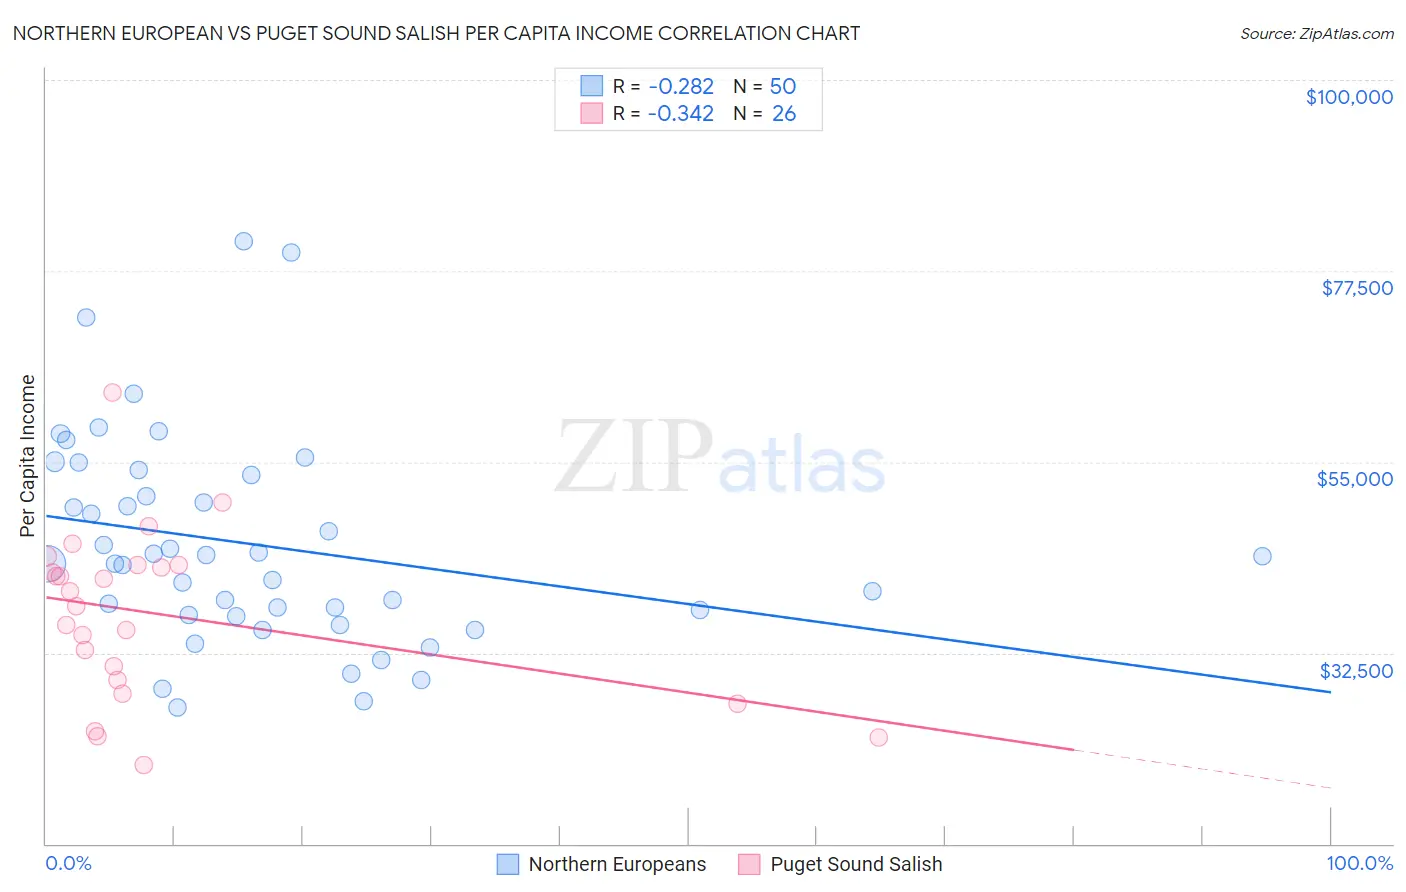
Northern European vs Puget Sound Salish Per Capita Income Correlation Chart
The statistical analysis conducted on geographies consisting of 406,105,495 people shows a weak negative correlation between the proportion of Northern Europeans and per capita income in the United States with a correlation coefficient (R) of -0.282 and weighted average of $47,698. Similarly, the statistical analysis conducted on geographies consisting of 46,155,865 people shows a mild negative correlation between the proportion of Puget Sound Salish and per capita income in the United States with a correlation coefficient (R) of -0.342 and weighted average of $41,495, a difference of 14.9%.
Per Capita Income Correlation Summary
| Measurement | Northern European | Puget Sound Salish |
| Minimum | $26,062 | $19,247 |
| Maximum | $80,940 | $63,213 |
| Range | $54,878 | $43,966 |
| Mean | $45,254 | $37,040 |
| Median | $43,430 | $38,913 |
| Interquartile 25% (IQ1) | $36,923 | $29,363 |
| Interquartile 75% (IQ3) | $53,441 | $42,776 |
| Interquartile Range (IQR) | $16,518 | $13,413 |
| Standard Deviation (Sample) | $12,375 | $10,042 |
| Standard Deviation (Population) | $12,250 | $9,847 |
Similar Demographics by Per Capita Income
Demographics Similar to Northern Europeans by Per Capita Income
In terms of per capita income, the demographic groups most similar to Northern Europeans are Croatian ($47,742, a difference of 0.090%), Italian ($47,574, a difference of 0.26%), Macedonian ($47,573, a difference of 0.26%), Immigrants from Moldova ($47,489, a difference of 0.44%), and Immigrants from Zimbabwe ($47,394, a difference of 0.64%).
| Demographics | Rating | Rank | Per Capita Income |
| Immigrants | Indonesia | 99.4 /100 | #82 | Exceptional $48,195 |
| Immigrants | Brazil | 99.4 /100 | #83 | Exceptional $48,164 |
| Immigrants | Ukraine | 99.3 /100 | #84 | Exceptional $48,134 |
| Austrians | 99.3 /100 | #85 | Exceptional $48,116 |
| Immigrants | Southern Europe | 99.3 /100 | #86 | Exceptional $48,027 |
| Ukrainians | 99.3 /100 | #87 | Exceptional $48,014 |
| Croatians | 99.0 /100 | #88 | Exceptional $47,742 |
| Northern Europeans | 98.9 /100 | #89 | Exceptional $47,698 |
| Italians | 98.8 /100 | #90 | Exceptional $47,574 |
| Macedonians | 98.8 /100 | #91 | Exceptional $47,573 |
| Immigrants | Moldova | 98.7 /100 | #92 | Exceptional $47,489 |
| Immigrants | Zimbabwe | 98.5 /100 | #93 | Exceptional $47,394 |
| Albanians | 98.5 /100 | #94 | Exceptional $47,379 |
| Immigrants | Egypt | 98.5 /100 | #95 | Exceptional $47,361 |
| Alsatians | 98.3 /100 | #96 | Exceptional $47,284 |
Demographics Similar to Puget Sound Salish by Per Capita Income
In terms of per capita income, the demographic groups most similar to Puget Sound Salish are Immigrants from Barbados ($41,478, a difference of 0.040%), Immigrants from Trinidad and Tobago ($41,476, a difference of 0.040%), Immigrants from Iraq ($41,365, a difference of 0.31%), Trinidadian and Tobagonian ($41,655, a difference of 0.39%), and Immigrants from Cameroon ($41,334, a difference of 0.39%).
| Demographics | Rating | Rank | Per Capita Income |
| Immigrants | Senegal | 11.3 /100 | #212 | Poor $41,830 |
| Immigrants | Venezuela | 10.2 /100 | #213 | Poor $41,727 |
| Immigrants | Bangladesh | 10.1 /100 | #214 | Poor $41,709 |
| Sudanese | 9.9 /100 | #215 | Tragic $41,695 |
| Tongans | 9.9 /100 | #216 | Tragic $41,693 |
| Guamanians/Chamorros | 9.7 /100 | #217 | Tragic $41,678 |
| Trinidadians and Tobagonians | 9.5 /100 | #218 | Tragic $41,655 |
| Puget Sound Salish | 8.1 /100 | #219 | Tragic $41,495 |
| Immigrants | Barbados | 7.9 /100 | #220 | Tragic $41,478 |
| Immigrants | Trinidad and Tobago | 7.9 /100 | #221 | Tragic $41,476 |
| Immigrants | Iraq | 7.1 /100 | #222 | Tragic $41,365 |
| Immigrants | Cameroon | 6.8 /100 | #223 | Tragic $41,334 |
| Immigrants | St. Vincent and the Grenadines | 6.4 /100 | #224 | Tragic $41,270 |
| West Indians | 6.0 /100 | #225 | Tragic $41,217 |
| Immigrants | Ecuador | 5.9 /100 | #226 | Tragic $41,195 |