German Russian vs Puget Sound Salish Per Capita Income
COMPARE
German Russian
Puget Sound Salish
Per Capita Income
Per Capita Income Comparison
German Russians
Puget Sound Salish
$40,266
PER CAPITA INCOME
2.2/ 100
METRIC RATING
243rd/ 347
METRIC RANK
$41,495
PER CAPITA INCOME
8.1/ 100
METRIC RATING
219th/ 347
METRIC RANK
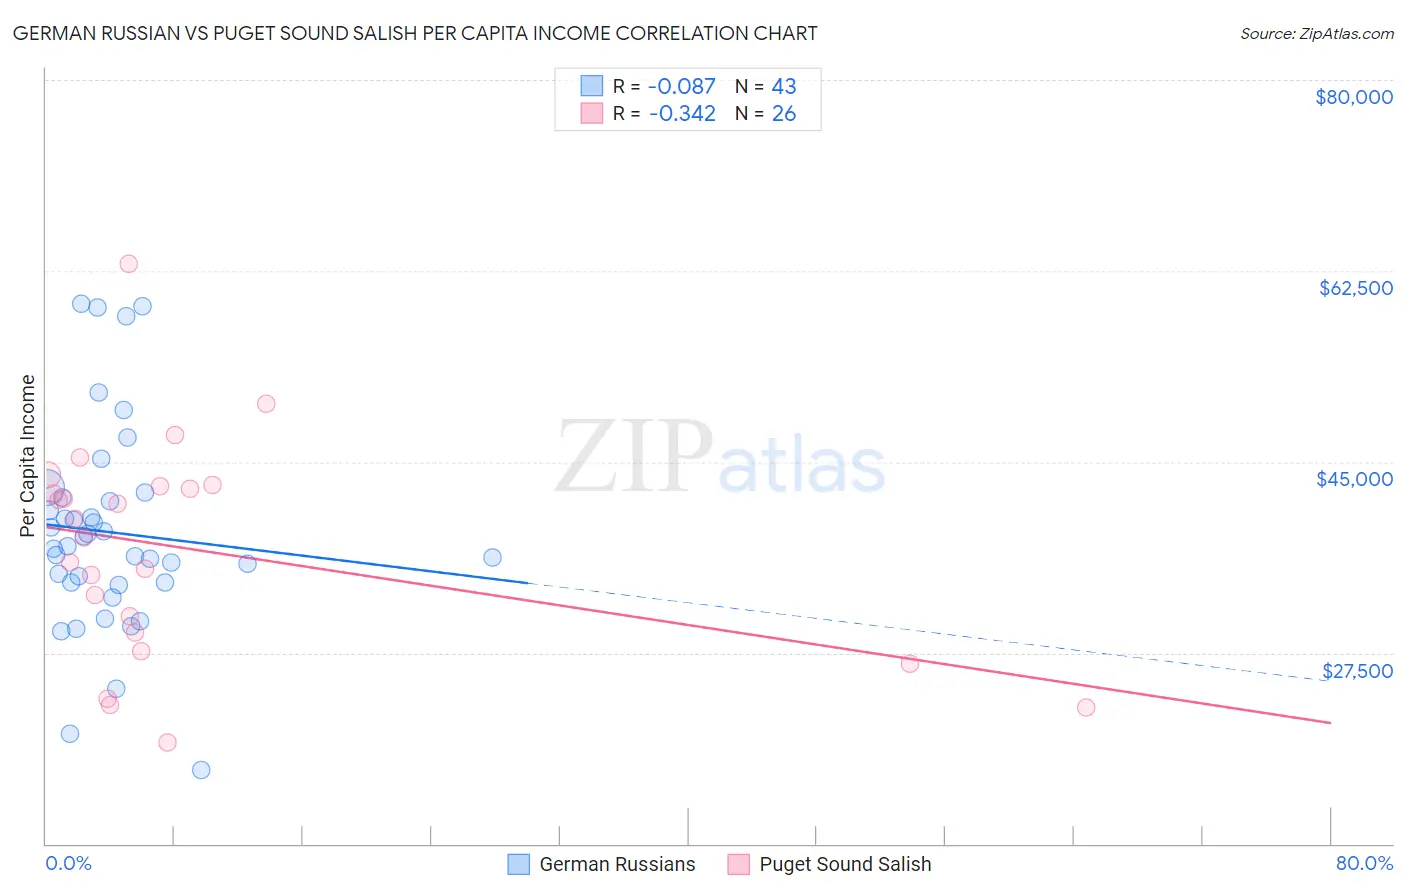
German Russian vs Puget Sound Salish Per Capita Income Correlation Chart
The statistical analysis conducted on geographies consisting of 96,461,984 people shows a slight negative correlation between the proportion of German Russians and per capita income in the United States with a correlation coefficient (R) of -0.087 and weighted average of $40,266. Similarly, the statistical analysis conducted on geographies consisting of 46,155,865 people shows a mild negative correlation between the proportion of Puget Sound Salish and per capita income in the United States with a correlation coefficient (R) of -0.342 and weighted average of $41,495, a difference of 3.0%.
Per Capita Income Correlation Summary
| Measurement | German Russian | Puget Sound Salish |
| Minimum | $16,776 | $19,247 |
| Maximum | $59,479 | $63,213 |
| Range | $42,703 | $43,966 |
| Mean | $38,536 | $37,040 |
| Median | $37,221 | $38,913 |
| Interquartile 25% (IQ1) | $33,912 | $29,363 |
| Interquartile 75% (IQ3) | $41,773 | $42,776 |
| Interquartile Range (IQR) | $7,861 | $13,413 |
| Standard Deviation (Sample) | $9,403 | $10,042 |
| Standard Deviation (Population) | $9,293 | $9,847 |
Similar Demographics by Per Capita Income
Demographics Similar to German Russians by Per Capita Income
In terms of per capita income, the demographic groups most similar to German Russians are French American Indian ($40,244, a difference of 0.060%), Immigrants from Western Africa ($40,294, a difference of 0.070%), British West Indian ($40,330, a difference of 0.16%), Immigrants from Nigeria ($40,339, a difference of 0.18%), and Tsimshian ($40,344, a difference of 0.19%).
| Demographics | Rating | Rank | Per Capita Income |
| Immigrants | Nonimmigrants | 3.4 /100 | #236 | Tragic $40,669 |
| Immigrants | Cambodia | 2.6 /100 | #237 | Tragic $40,434 |
| Somalis | 2.4 /100 | #238 | Tragic $40,367 |
| Tsimshian | 2.4 /100 | #239 | Tragic $40,344 |
| Immigrants | Nigeria | 2.3 /100 | #240 | Tragic $40,339 |
| British West Indians | 2.3 /100 | #241 | Tragic $40,330 |
| Immigrants | Western Africa | 2.2 /100 | #242 | Tragic $40,294 |
| German Russians | 2.2 /100 | #243 | Tragic $40,266 |
| French American Indians | 2.1 /100 | #244 | Tragic $40,244 |
| Sub-Saharan Africans | 1.9 /100 | #245 | Tragic $40,152 |
| Cree | 1.7 /100 | #246 | Tragic $40,056 |
| Immigrants | Somalia | 1.6 /100 | #247 | Tragic $39,974 |
| Cape Verdeans | 1.5 /100 | #248 | Tragic $39,935 |
| Japanese | 1.4 /100 | #249 | Tragic $39,870 |
| Immigrants | Burma/Myanmar | 1.3 /100 | #250 | Tragic $39,827 |
Demographics Similar to Puget Sound Salish by Per Capita Income
In terms of per capita income, the demographic groups most similar to Puget Sound Salish are Immigrants from Barbados ($41,478, a difference of 0.040%), Immigrants from Trinidad and Tobago ($41,476, a difference of 0.040%), Immigrants from Iraq ($41,365, a difference of 0.31%), Trinidadian and Tobagonian ($41,655, a difference of 0.39%), and Immigrants from Cameroon ($41,334, a difference of 0.39%).
| Demographics | Rating | Rank | Per Capita Income |
| Immigrants | Senegal | 11.3 /100 | #212 | Poor $41,830 |
| Immigrants | Venezuela | 10.2 /100 | #213 | Poor $41,727 |
| Immigrants | Bangladesh | 10.1 /100 | #214 | Poor $41,709 |
| Sudanese | 9.9 /100 | #215 | Tragic $41,695 |
| Tongans | 9.9 /100 | #216 | Tragic $41,693 |
| Guamanians/Chamorros | 9.7 /100 | #217 | Tragic $41,678 |
| Trinidadians and Tobagonians | 9.5 /100 | #218 | Tragic $41,655 |
| Puget Sound Salish | 8.1 /100 | #219 | Tragic $41,495 |
| Immigrants | Barbados | 7.9 /100 | #220 | Tragic $41,478 |
| Immigrants | Trinidad and Tobago | 7.9 /100 | #221 | Tragic $41,476 |
| Immigrants | Iraq | 7.1 /100 | #222 | Tragic $41,365 |
| Immigrants | Cameroon | 6.8 /100 | #223 | Tragic $41,334 |
| Immigrants | St. Vincent and the Grenadines | 6.4 /100 | #224 | Tragic $41,270 |
| West Indians | 6.0 /100 | #225 | Tragic $41,217 |
| Immigrants | Ecuador | 5.9 /100 | #226 | Tragic $41,195 |