Cape Verdean vs Mexican American Indian Per Capita Income
COMPARE
Cape Verdean
Mexican American Indian
Per Capita Income
Per Capita Income Comparison
Cape Verdeans
Mexican American Indians
$39,935
PER CAPITA INCOME
1.5/ 100
METRIC RATING
248th/ 347
METRIC RANK
$37,407
PER CAPITA INCOME
0.1/ 100
METRIC RATING
293rd/ 347
METRIC RANK
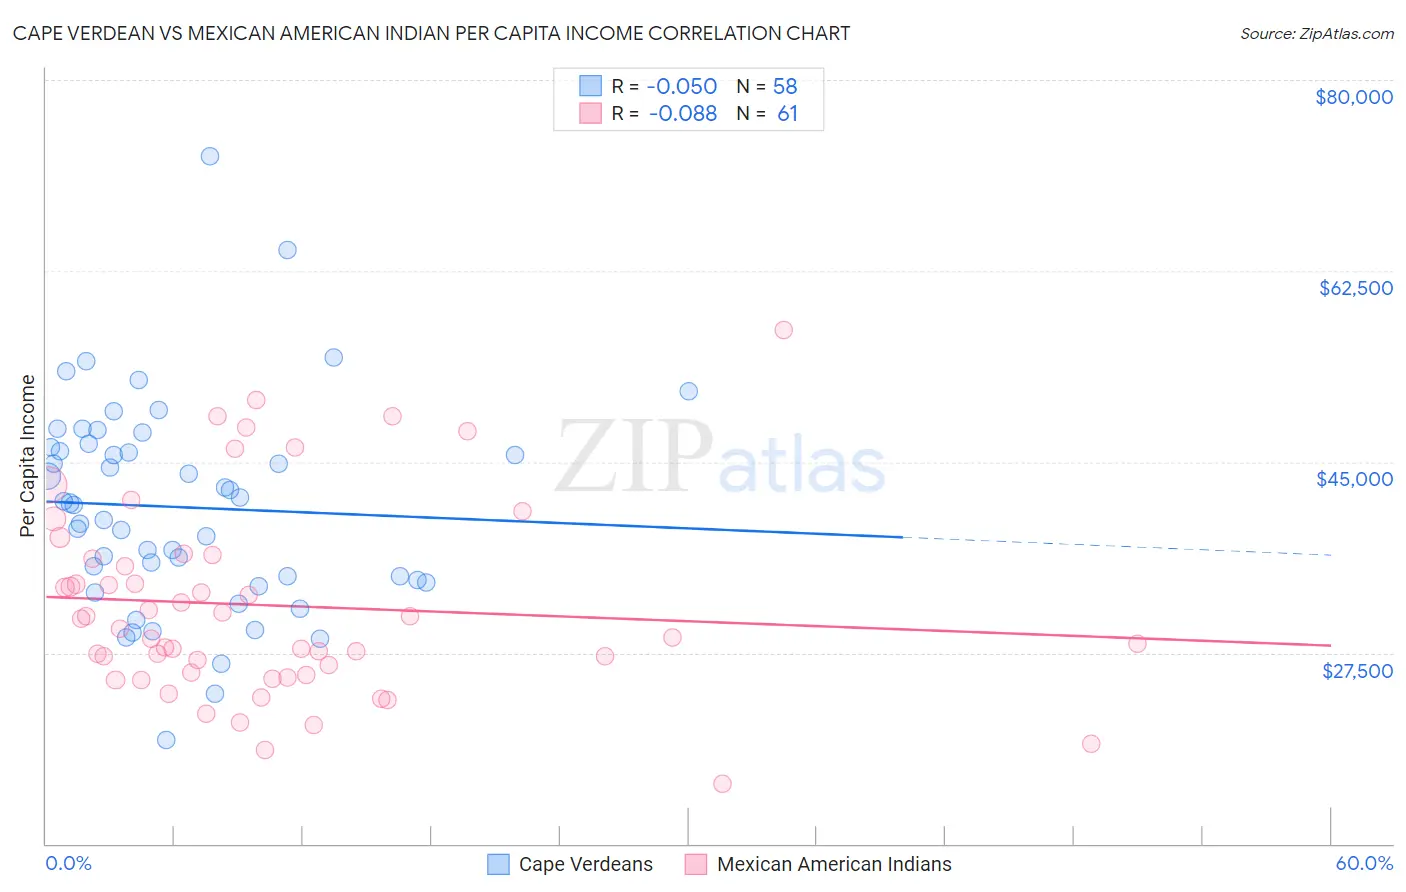
Cape Verdean vs Mexican American Indian Per Capita Income Correlation Chart
The statistical analysis conducted on geographies consisting of 107,581,213 people shows no correlation between the proportion of Cape Verdeans and per capita income in the United States with a correlation coefficient (R) of -0.050 and weighted average of $39,935. Similarly, the statistical analysis conducted on geographies consisting of 317,620,021 people shows a slight negative correlation between the proportion of Mexican American Indians and per capita income in the United States with a correlation coefficient (R) of -0.088 and weighted average of $37,407, a difference of 6.8%.
Per Capita Income Correlation Summary
| Measurement | Cape Verdean | Mexican American Indian |
| Minimum | $19,552 | $15,543 |
| Maximum | $72,967 | $57,099 |
| Range | $53,415 | $41,556 |
| Mean | $40,842 | $31,846 |
| Median | $41,136 | $29,756 |
| Interquartile 25% (IQ1) | $34,180 | $25,545 |
| Interquartile 75% (IQ3) | $46,319 | $36,256 |
| Interquartile Range (IQR) | $12,139 | $10,711 |
| Standard Deviation (Sample) | $9,616 | $8,902 |
| Standard Deviation (Population) | $9,533 | $8,828 |
Similar Demographics by Per Capita Income
Demographics Similar to Cape Verdeans by Per Capita Income
In terms of per capita income, the demographic groups most similar to Cape Verdeans are Immigrants from Somalia ($39,974, a difference of 0.10%), Japanese ($39,870, a difference of 0.16%), Immigrants from Burma/Myanmar ($39,827, a difference of 0.27%), Samoan ($39,826, a difference of 0.27%), and Cree ($40,056, a difference of 0.30%).
| Demographics | Rating | Rank | Per Capita Income |
| British West Indians | 2.3 /100 | #241 | Tragic $40,330 |
| Immigrants | Western Africa | 2.2 /100 | #242 | Tragic $40,294 |
| German Russians | 2.2 /100 | #243 | Tragic $40,266 |
| French American Indians | 2.1 /100 | #244 | Tragic $40,244 |
| Sub-Saharan Africans | 1.9 /100 | #245 | Tragic $40,152 |
| Cree | 1.7 /100 | #246 | Tragic $40,056 |
| Immigrants | Somalia | 1.6 /100 | #247 | Tragic $39,974 |
| Cape Verdeans | 1.5 /100 | #248 | Tragic $39,935 |
| Japanese | 1.4 /100 | #249 | Tragic $39,870 |
| Immigrants | Burma/Myanmar | 1.3 /100 | #250 | Tragic $39,827 |
| Samoans | 1.3 /100 | #251 | Tragic $39,826 |
| Immigrants | Azores | 1.0 /100 | #252 | Tragic $39,608 |
| Osage | 1.0 /100 | #253 | Tragic $39,568 |
| Alaska Natives | 1.0 /100 | #254 | Tragic $39,558 |
| Immigrants | Middle Africa | 1.0 /100 | #255 | Tragic $39,529 |
Demographics Similar to Mexican American Indians by Per Capita Income
In terms of per capita income, the demographic groups most similar to Mexican American Indians are Cuban ($37,383, a difference of 0.070%), Immigrants from Micronesia ($37,464, a difference of 0.15%), Immigrants from Dominican Republic ($37,306, a difference of 0.27%), Indonesian ($37,300, a difference of 0.29%), and Cajun ($37,527, a difference of 0.32%).
| Demographics | Rating | Rank | Per Capita Income |
| Central American Indians | 0.1 /100 | #286 | Tragic $37,699 |
| Dominicans | 0.1 /100 | #287 | Tragic $37,697 |
| Blackfeet | 0.1 /100 | #288 | Tragic $37,695 |
| U.S. Virgin Islanders | 0.1 /100 | #289 | Tragic $37,589 |
| Immigrants | Guatemala | 0.1 /100 | #290 | Tragic $37,550 |
| Cajuns | 0.1 /100 | #291 | Tragic $37,527 |
| Immigrants | Micronesia | 0.1 /100 | #292 | Tragic $37,464 |
| Mexican American Indians | 0.1 /100 | #293 | Tragic $37,407 |
| Cubans | 0.1 /100 | #294 | Tragic $37,383 |
| Immigrants | Dominican Republic | 0.1 /100 | #295 | Tragic $37,306 |
| Indonesians | 0.1 /100 | #296 | Tragic $37,300 |
| Haitians | 0.1 /100 | #297 | Tragic $37,289 |
| Immigrants | Caribbean | 0.1 /100 | #298 | Tragic $37,254 |
| Cherokee | 0.1 /100 | #299 | Tragic $37,203 |
| Immigrants | Bahamas | 0.1 /100 | #300 | Tragic $37,193 |