Romanian vs Mexican American Indian Male Unemployment
COMPARE
Romanian
Mexican American Indian
Male Unemployment
Male Unemployment Comparison
Romanians
Mexican American Indians
5.1%
MALE UNEMPLOYMENT
89.8/ 100
METRIC RATING
114th/ 347
METRIC RANK
5.8%
MALE UNEMPLOYMENT
0.2/ 100
METRIC RATING
253rd/ 347
METRIC RANK
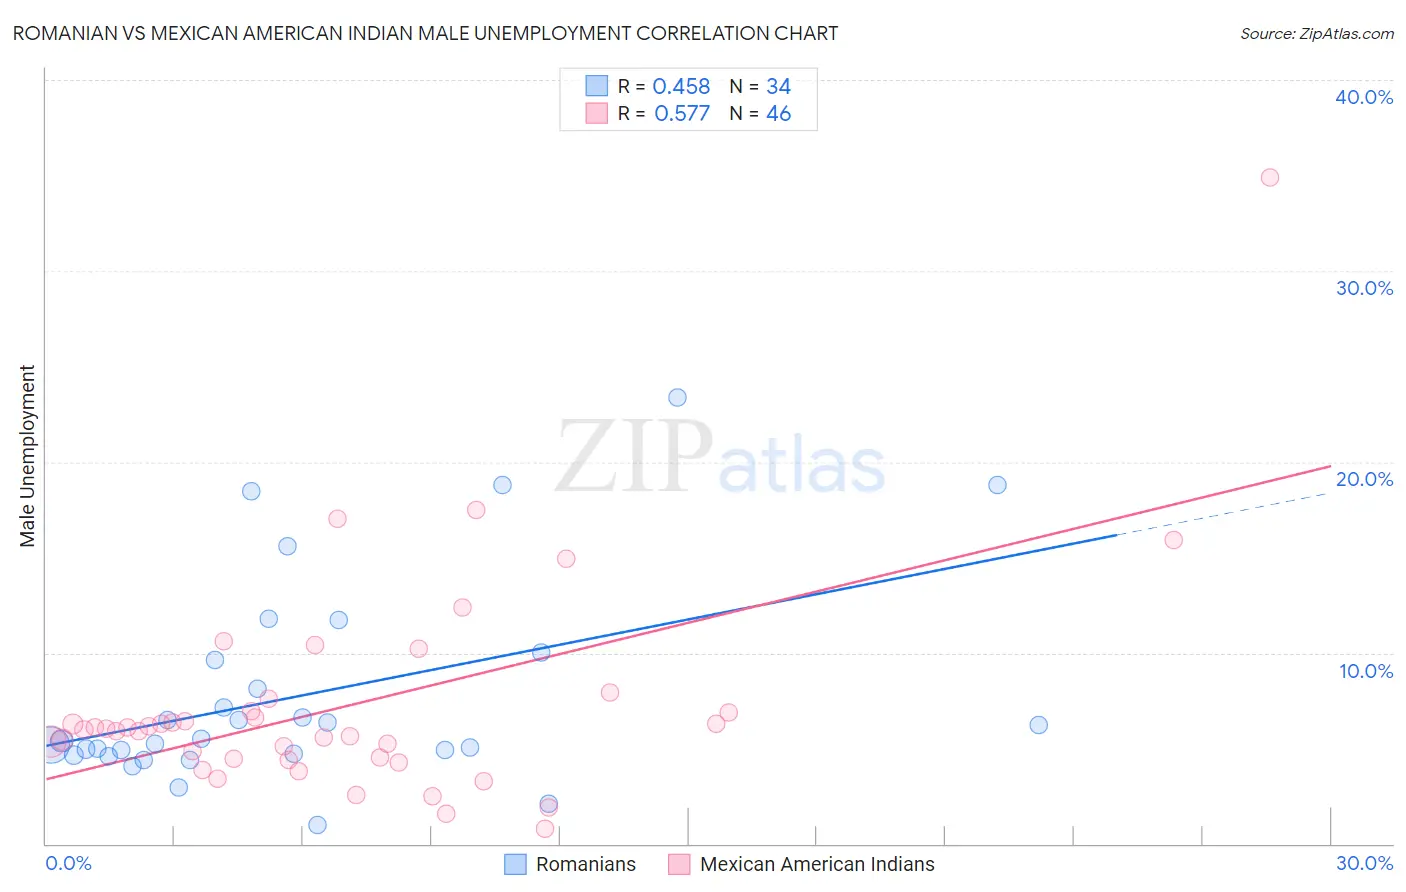
Romanian vs Mexican American Indian Male Unemployment Correlation Chart
The statistical analysis conducted on geographies consisting of 376,462,123 people shows a moderate positive correlation between the proportion of Romanians and unemployment rate among males in the United States with a correlation coefficient (R) of 0.458 and weighted average of 5.1%. Similarly, the statistical analysis conducted on geographies consisting of 316,861,577 people shows a substantial positive correlation between the proportion of Mexican American Indians and unemployment rate among males in the United States with a correlation coefficient (R) of 0.577 and weighted average of 5.8%, a difference of 12.6%.
Male Unemployment Correlation Summary
| Measurement | Romanian | Mexican American Indian |
| Minimum | 1.0% | 0.80% |
| Maximum | 23.4% | 34.9% |
| Range | 22.4% | 34.1% |
| Mean | 7.8% | 7.2% |
| Median | 5.4% | 6.0% |
| Interquartile 25% (IQ1) | 4.7% | 4.4% |
| Interquartile 75% (IQ3) | 9.6% | 6.9% |
| Interquartile Range (IQR) | 4.9% | 2.5% |
| Standard Deviation (Sample) | 5.3% | 5.6% |
| Standard Deviation (Population) | 5.3% | 5.6% |
Similar Demographics by Male Unemployment
Demographics Similar to Romanians by Male Unemployment
In terms of male unemployment, the demographic groups most similar to Romanians are Immigrants from Asia (5.1%, a difference of 0.030%), Immigrants from Denmark (5.1%, a difference of 0.070%), Immigrants from Moldova (5.1%, a difference of 0.080%), Immigrants from Austria (5.1%, a difference of 0.080%), and Estonian (5.1%, a difference of 0.12%).
| Demographics | Rating | Rank | Male Unemployment |
| Ethiopians | 91.3 /100 | #107 | Exceptional 5.1% |
| Immigrants | Nicaragua | 91.2 /100 | #108 | Exceptional 5.1% |
| Immigrants | Pakistan | 90.9 /100 | #109 | Exceptional 5.1% |
| Immigrants | England | 90.8 /100 | #110 | Exceptional 5.1% |
| Immigrants | Eastern Asia | 90.8 /100 | #111 | Exceptional 5.1% |
| Immigrants | Moldova | 90.3 /100 | #112 | Exceptional 5.1% |
| Immigrants | Austria | 90.3 /100 | #113 | Exceptional 5.1% |
| Romanians | 89.8 /100 | #114 | Excellent 5.1% |
| Immigrants | Asia | 89.6 /100 | #115 | Excellent 5.1% |
| Immigrants | Denmark | 89.4 /100 | #116 | Excellent 5.1% |
| Estonians | 89.0 /100 | #117 | Excellent 5.1% |
| Cypriots | 88.8 /100 | #118 | Excellent 5.1% |
| French Canadians | 88.6 /100 | #119 | Excellent 5.1% |
| Ukrainians | 88.4 /100 | #120 | Excellent 5.1% |
| Mongolians | 88.4 /100 | #121 | Excellent 5.1% |
Demographics Similar to Mexican American Indians by Male Unemployment
In terms of male unemployment, the demographic groups most similar to Mexican American Indians are Mexican (5.8%, a difference of 0.13%), Japanese (5.8%, a difference of 0.17%), Kiowa (5.8%, a difference of 0.28%), Comanche (5.8%, a difference of 0.35%), and Hispanic or Latino (5.8%, a difference of 0.52%).
| Demographics | Rating | Rank | Male Unemployment |
| Iroquois | 0.6 /100 | #246 | Tragic 5.7% |
| Hawaiians | 0.6 /100 | #247 | Tragic 5.7% |
| Marshallese | 0.5 /100 | #248 | Tragic 5.7% |
| Cree | 0.4 /100 | #249 | Tragic 5.7% |
| Immigrants | Bahamas | 0.4 /100 | #250 | Tragic 5.7% |
| Spanish Americans | 0.3 /100 | #251 | Tragic 5.7% |
| Mexicans | 0.2 /100 | #252 | Tragic 5.8% |
| Mexican American Indians | 0.2 /100 | #253 | Tragic 5.8% |
| Japanese | 0.2 /100 | #254 | Tragic 5.8% |
| Kiowa | 0.2 /100 | #255 | Tragic 5.8% |
| Comanche | 0.2 /100 | #256 | Tragic 5.8% |
| Hispanics or Latinos | 0.1 /100 | #257 | Tragic 5.8% |
| Dutch West Indians | 0.1 /100 | #258 | Tragic 5.8% |
| Cajuns | 0.1 /100 | #259 | Tragic 5.8% |
| Immigrants | Central America | 0.1 /100 | #260 | Tragic 5.8% |