Romanian vs Immigrants from Romania Median Household Income
COMPARE
Romanian
Immigrants from Romania
Median Household Income
Median Household Income Comparison
Romanians
Immigrants from Romania
$91,994
MEDIAN HOUSEHOLD INCOME
98.8/ 100
METRIC RATING
89th/ 347
METRIC RANK
$94,222
MEDIAN HOUSEHOLD INCOME
99.7/ 100
METRIC RATING
66th/ 347
METRIC RANK
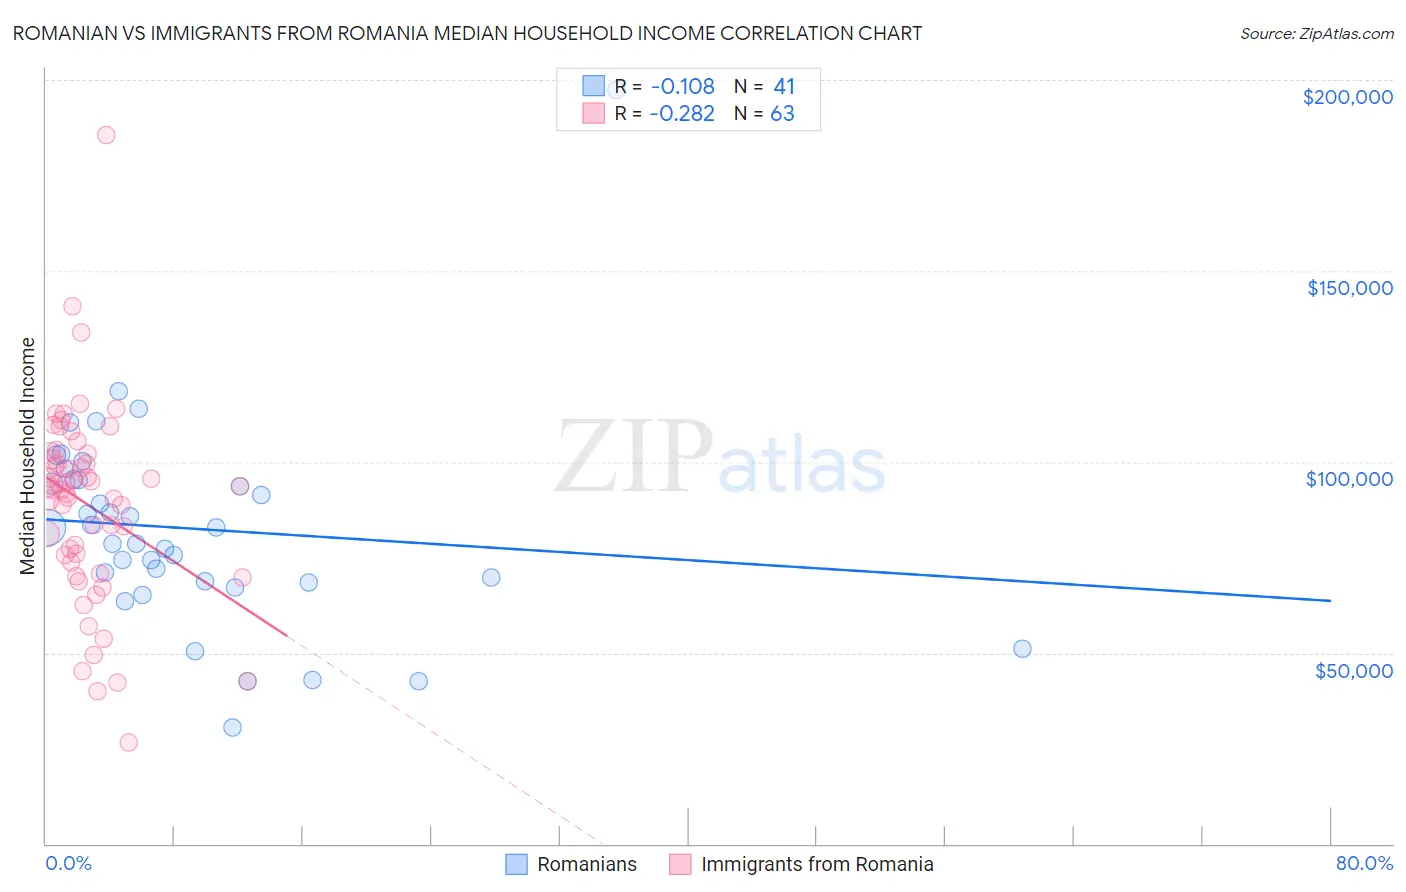
Romanian vs Immigrants from Romania Median Household Income Correlation Chart
The statistical analysis conducted on geographies consisting of 377,637,037 people shows a poor negative correlation between the proportion of Romanians and median household income in the United States with a correlation coefficient (R) of -0.108 and weighted average of $91,994. Similarly, the statistical analysis conducted on geographies consisting of 256,926,750 people shows a weak negative correlation between the proportion of Immigrants from Romania and median household income in the United States with a correlation coefficient (R) of -0.282 and weighted average of $94,222, a difference of 2.4%.
Median Household Income Correlation Summary
| Measurement | Romanian | Immigrants from Romania |
| Minimum | $30,320 | $26,354 |
| Maximum | $197,500 | $185,464 |
| Range | $167,180 | $159,110 |
| Mean | $82,526 | $88,756 |
| Median | $82,785 | $92,853 |
| Interquartile 25% (IQ1) | $68,581 | $73,566 |
| Interquartile 75% (IQ3) | $95,353 | $102,083 |
| Interquartile Range (IQR) | $26,772 | $28,517 |
| Standard Deviation (Sample) | $27,672 | $25,703 |
| Standard Deviation (Population) | $27,332 | $25,499 |
Similar Demographics by Median Household Income
Demographics Similar to Romanians by Median Household Income
In terms of median household income, the demographic groups most similar to Romanians are Assyrian/Chaldean/Syriac ($91,991, a difference of 0.0%), Immigrants from Vietnam ($91,987, a difference of 0.010%), Immigrants from Canada ($92,029, a difference of 0.040%), Immigrants from Western Europe ($91,936, a difference of 0.060%), and Immigrants from England ($92,098, a difference of 0.11%).
| Demographics | Rating | Rank | Median Household Income |
| Immigrants | Spain | 99.3 /100 | #82 | Exceptional $92,732 |
| Italians | 99.1 /100 | #83 | Exceptional $92,475 |
| Immigrants | Argentina | 99.1 /100 | #84 | Exceptional $92,417 |
| Immigrants | Croatia | 99.0 /100 | #85 | Exceptional $92,225 |
| Immigrants | England | 98.9 /100 | #86 | Exceptional $92,098 |
| Immigrants | Hungary | 98.9 /100 | #87 | Exceptional $92,094 |
| Immigrants | Canada | 98.8 /100 | #88 | Exceptional $92,029 |
| Romanians | 98.8 /100 | #89 | Exceptional $91,994 |
| Assyrians/Chaldeans/Syriacs | 98.8 /100 | #90 | Exceptional $91,991 |
| Immigrants | Vietnam | 98.8 /100 | #91 | Exceptional $91,987 |
| Immigrants | Western Europe | 98.8 /100 | #92 | Exceptional $91,936 |
| Immigrants | Lebanon | 98.7 /100 | #93 | Exceptional $91,887 |
| Immigrants | North America | 98.7 /100 | #94 | Exceptional $91,860 |
| Armenians | 98.7 /100 | #95 | Exceptional $91,807 |
| Jordanians | 98.7 /100 | #96 | Exceptional $91,794 |
Demographics Similar to Immigrants from Romania by Median Household Income
In terms of median household income, the demographic groups most similar to Immigrants from Romania are Immigrants from Scotland ($94,091, a difference of 0.14%), Immigrants from Belarus ($94,399, a difference of 0.19%), Immigrants from Netherlands ($94,411, a difference of 0.20%), Mongolian ($93,971, a difference of 0.27%), and Argentinean ($93,960, a difference of 0.28%).
| Demographics | Rating | Rank | Median Household Income |
| Immigrants | Europe | 99.8 /100 | #59 | Exceptional $95,032 |
| Koreans | 99.8 /100 | #60 | Exceptional $95,018 |
| Laotians | 99.8 /100 | #61 | Exceptional $94,990 |
| Immigrants | Norway | 99.8 /100 | #62 | Exceptional $94,846 |
| Greeks | 99.8 /100 | #63 | Exceptional $94,735 |
| Immigrants | Netherlands | 99.7 /100 | #64 | Exceptional $94,411 |
| Immigrants | Belarus | 99.7 /100 | #65 | Exceptional $94,399 |
| Immigrants | Romania | 99.7 /100 | #66 | Exceptional $94,222 |
| Immigrants | Scotland | 99.7 /100 | #67 | Exceptional $94,091 |
| Mongolians | 99.7 /100 | #68 | Exceptional $93,971 |
| Argentineans | 99.7 /100 | #69 | Exceptional $93,960 |
| Immigrants | Fiji | 99.7 /100 | #70 | Exceptional $93,933 |
| Immigrants | Philippines | 99.6 /100 | #71 | Exceptional $93,899 |
| Lithuanians | 99.6 /100 | #72 | Exceptional $93,852 |
| Immigrants | Egypt | 99.6 /100 | #73 | Exceptional $93,700 |