Immigrants from Russia vs Immigrants from Romania Median Household Income
COMPARE
Immigrants from Russia
Immigrants from Romania
Median Household Income
Median Household Income Comparison
Immigrants from Russia
Immigrants from Romania
$96,378
MEDIAN HOUSEHOLD INCOME
99.9/ 100
METRIC RATING
47th/ 347
METRIC RANK
$94,222
MEDIAN HOUSEHOLD INCOME
99.7/ 100
METRIC RATING
66th/ 347
METRIC RANK
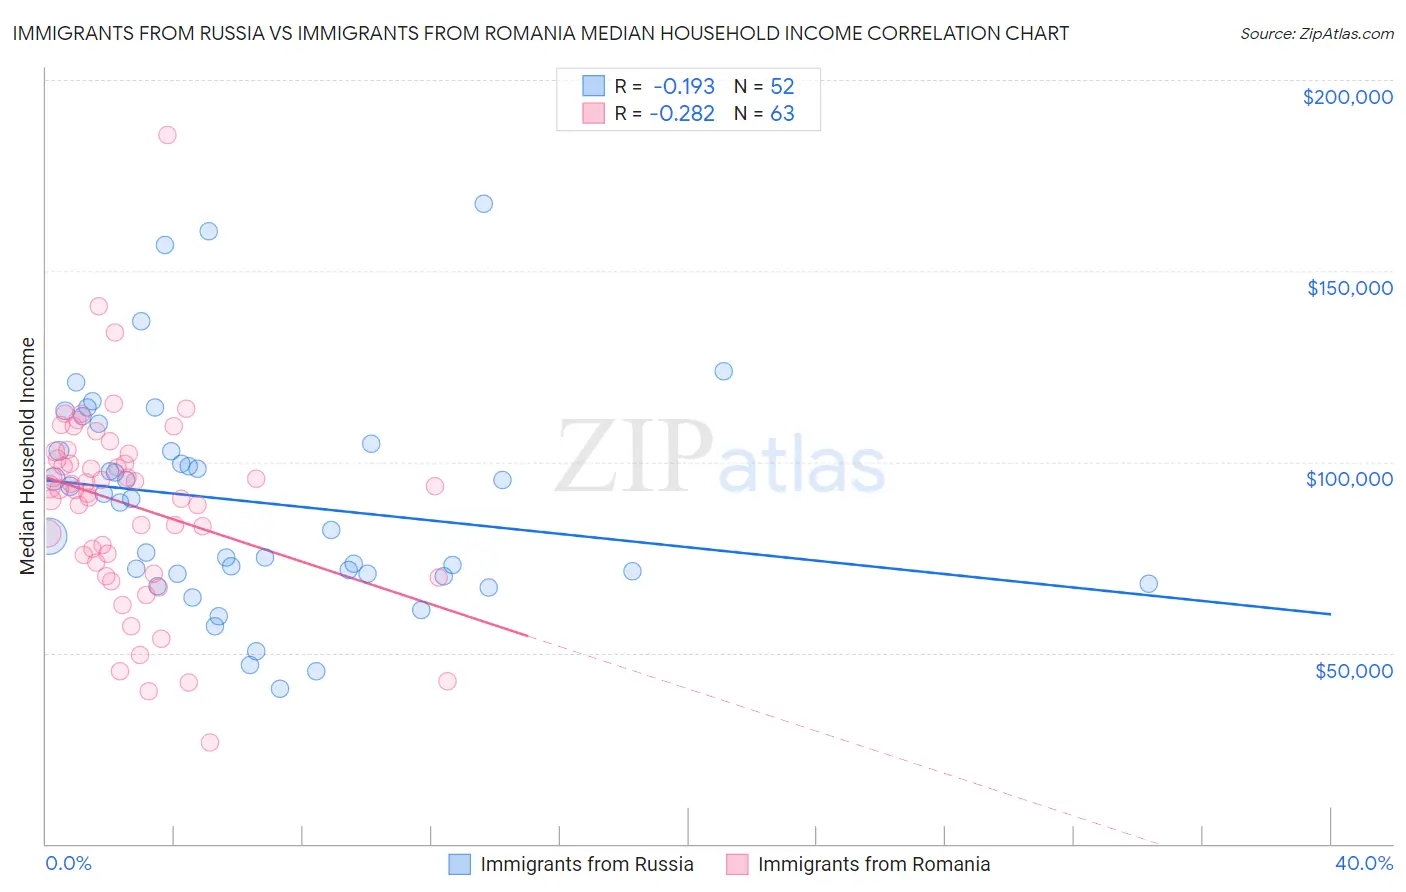
Immigrants from Russia vs Immigrants from Romania Median Household Income Correlation Chart
The statistical analysis conducted on geographies consisting of 347,675,291 people shows a poor negative correlation between the proportion of Immigrants from Russia and median household income in the United States with a correlation coefficient (R) of -0.193 and weighted average of $96,378. Similarly, the statistical analysis conducted on geographies consisting of 256,926,750 people shows a weak negative correlation between the proportion of Immigrants from Romania and median household income in the United States with a correlation coefficient (R) of -0.282 and weighted average of $94,222, a difference of 2.3%.
Median Household Income Correlation Summary
| Measurement | Immigrants from Russia | Immigrants from Romania |
| Minimum | $40,467 | $26,354 |
| Maximum | $167,656 | $185,464 |
| Range | $127,189 | $159,110 |
| Mean | $89,609 | $88,756 |
| Median | $89,857 | $92,853 |
| Interquartile 25% (IQ1) | $70,618 | $73,566 |
| Interquartile 75% (IQ3) | $103,868 | $102,083 |
| Interquartile Range (IQR) | $33,250 | $28,517 |
| Standard Deviation (Sample) | $28,243 | $25,703 |
| Standard Deviation (Population) | $27,970 | $25,499 |
Demographics Similar to Immigrants from Russia and Immigrants from Romania by Median Household Income
In terms of median household income, the demographic groups most similar to Immigrants from Russia are Cambodian ($96,324, a difference of 0.060%), Immigrants from Malaysia ($96,292, a difference of 0.090%), Bulgarian ($96,290, a difference of 0.090%), Australian ($96,490, a difference of 0.12%), and Estonian ($95,930, a difference of 0.47%). Similarly, the demographic groups most similar to Immigrants from Romania are Immigrants from Belarus ($94,399, a difference of 0.19%), Immigrants from Netherlands ($94,411, a difference of 0.20%), Greek ($94,735, a difference of 0.54%), Immigrants from Norway ($94,846, a difference of 0.66%), and Laotian ($94,990, a difference of 0.82%).
| Demographics | Rating | Rank | Median Household Income |
| Australians | 99.9 /100 | #46 | Exceptional $96,490 |
| Immigrants | Russia | 99.9 /100 | #47 | Exceptional $96,378 |
| Cambodians | 99.9 /100 | #48 | Exceptional $96,324 |
| Immigrants | Malaysia | 99.9 /100 | #49 | Exceptional $96,292 |
| Bulgarians | 99.9 /100 | #50 | Exceptional $96,290 |
| Estonians | 99.9 /100 | #51 | Exceptional $95,930 |
| Immigrants | South Africa | 99.9 /100 | #52 | Exceptional $95,800 |
| Paraguayans | 99.9 /100 | #53 | Exceptional $95,737 |
| Egyptians | 99.9 /100 | #54 | Exceptional $95,673 |
| Immigrants | Czechoslovakia | 99.9 /100 | #55 | Exceptional $95,319 |
| Immigrants | Austria | 99.9 /100 | #56 | Exceptional $95,277 |
| New Zealanders | 99.8 /100 | #57 | Exceptional $95,146 |
| Soviet Union | 99.8 /100 | #58 | Exceptional $95,098 |
| Immigrants | Europe | 99.8 /100 | #59 | Exceptional $95,032 |
| Koreans | 99.8 /100 | #60 | Exceptional $95,018 |
| Laotians | 99.8 /100 | #61 | Exceptional $94,990 |
| Immigrants | Norway | 99.8 /100 | #62 | Exceptional $94,846 |
| Greeks | 99.8 /100 | #63 | Exceptional $94,735 |
| Immigrants | Netherlands | 99.7 /100 | #64 | Exceptional $94,411 |
| Immigrants | Belarus | 99.7 /100 | #65 | Exceptional $94,399 |
| Immigrants | Romania | 99.7 /100 | #66 | Exceptional $94,222 |