Romanian vs Immigrants from Congo Median Household Income
COMPARE
Romanian
Immigrants from Congo
Median Household Income
Median Household Income Comparison
Romanians
Immigrants from Congo
$91,994
MEDIAN HOUSEHOLD INCOME
98.8/ 100
METRIC RATING
89th/ 347
METRIC RANK
$66,768
MEDIAN HOUSEHOLD INCOME
0.0/ 100
METRIC RATING
336th/ 347
METRIC RANK
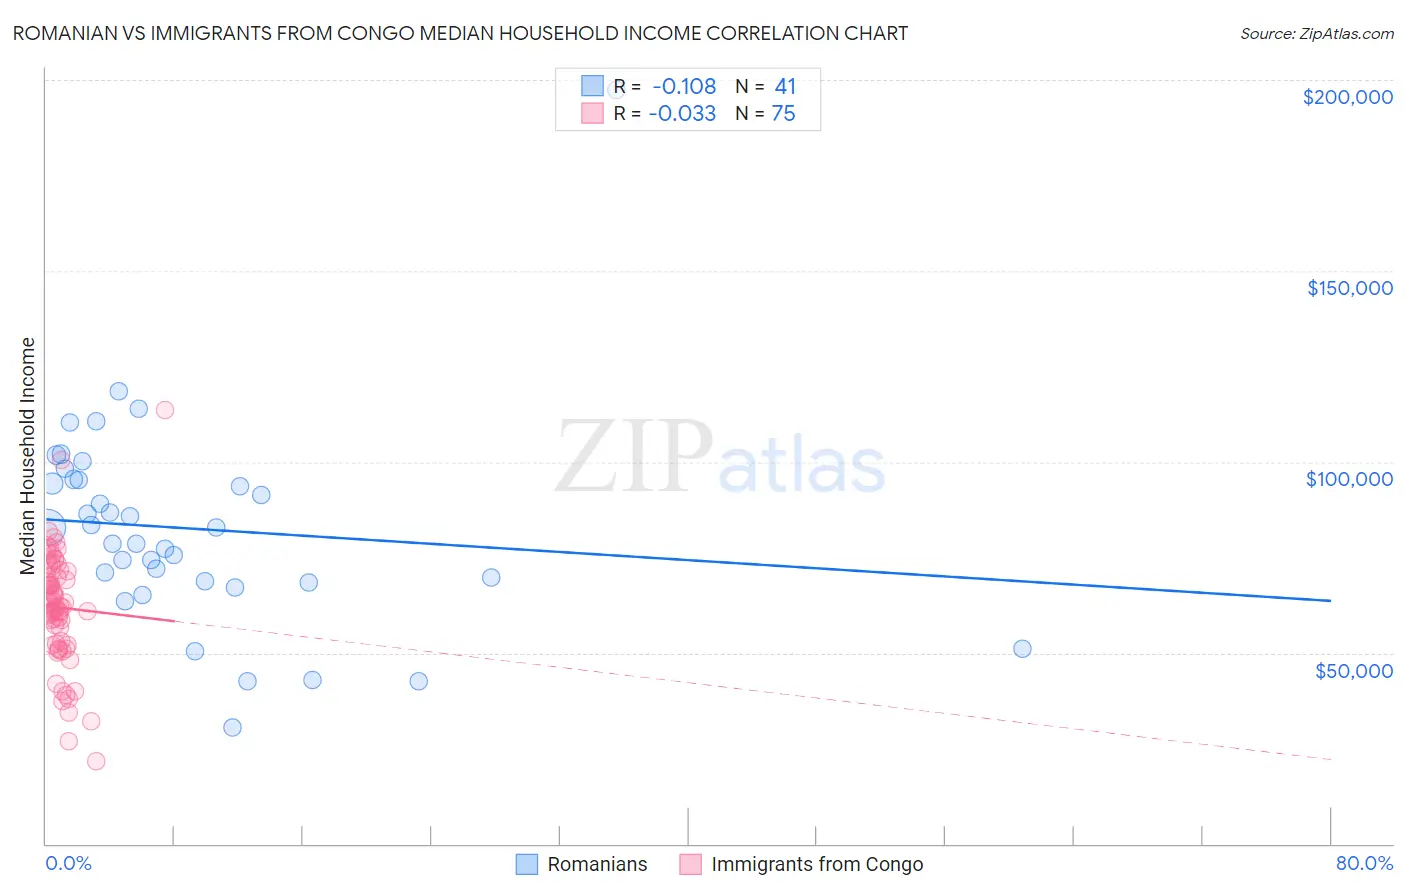
Romanian vs Immigrants from Congo Median Household Income Correlation Chart
The statistical analysis conducted on geographies consisting of 377,637,037 people shows a poor negative correlation between the proportion of Romanians and median household income in the United States with a correlation coefficient (R) of -0.108 and weighted average of $91,994. Similarly, the statistical analysis conducted on geographies consisting of 92,065,095 people shows no correlation between the proportion of Immigrants from Congo and median household income in the United States with a correlation coefficient (R) of -0.033 and weighted average of $66,768, a difference of 37.8%.
Median Household Income Correlation Summary
| Measurement | Romanian | Immigrants from Congo |
| Minimum | $30,320 | $21,567 |
| Maximum | $197,500 | $113,664 |
| Range | $167,180 | $92,097 |
| Mean | $82,526 | $61,890 |
| Median | $82,785 | $62,087 |
| Interquartile 25% (IQ1) | $68,581 | $52,383 |
| Interquartile 75% (IQ3) | $95,353 | $71,250 |
| Interquartile Range (IQR) | $26,772 | $18,867 |
| Standard Deviation (Sample) | $27,672 | $15,094 |
| Standard Deviation (Population) | $27,332 | $14,993 |
Similar Demographics by Median Household Income
Demographics Similar to Romanians by Median Household Income
In terms of median household income, the demographic groups most similar to Romanians are Assyrian/Chaldean/Syriac ($91,991, a difference of 0.0%), Immigrants from Vietnam ($91,987, a difference of 0.010%), Immigrants from Canada ($92,029, a difference of 0.040%), Immigrants from Western Europe ($91,936, a difference of 0.060%), and Immigrants from England ($92,098, a difference of 0.11%).
| Demographics | Rating | Rank | Median Household Income |
| Immigrants | Spain | 99.3 /100 | #82 | Exceptional $92,732 |
| Italians | 99.1 /100 | #83 | Exceptional $92,475 |
| Immigrants | Argentina | 99.1 /100 | #84 | Exceptional $92,417 |
| Immigrants | Croatia | 99.0 /100 | #85 | Exceptional $92,225 |
| Immigrants | England | 98.9 /100 | #86 | Exceptional $92,098 |
| Immigrants | Hungary | 98.9 /100 | #87 | Exceptional $92,094 |
| Immigrants | Canada | 98.8 /100 | #88 | Exceptional $92,029 |
| Romanians | 98.8 /100 | #89 | Exceptional $91,994 |
| Assyrians/Chaldeans/Syriacs | 98.8 /100 | #90 | Exceptional $91,991 |
| Immigrants | Vietnam | 98.8 /100 | #91 | Exceptional $91,987 |
| Immigrants | Western Europe | 98.8 /100 | #92 | Exceptional $91,936 |
| Immigrants | Lebanon | 98.7 /100 | #93 | Exceptional $91,887 |
| Immigrants | North America | 98.7 /100 | #94 | Exceptional $91,860 |
| Armenians | 98.7 /100 | #95 | Exceptional $91,807 |
| Jordanians | 98.7 /100 | #96 | Exceptional $91,794 |
Demographics Similar to Immigrants from Congo by Median Household Income
In terms of median household income, the demographic groups most similar to Immigrants from Congo are Cheyenne ($66,974, a difference of 0.31%), Black/African American ($67,573, a difference of 1.2%), Kiowa ($65,914, a difference of 1.3%), Creek ($67,715, a difference of 1.4%), and Sioux ($67,792, a difference of 1.5%).
| Demographics | Rating | Rank | Median Household Income |
| Dutch West Indians | 0.0 /100 | #329 | Tragic $68,412 |
| Arapaho | 0.0 /100 | #330 | Tragic $67,965 |
| Natives/Alaskans | 0.0 /100 | #331 | Tragic $67,879 |
| Sioux | 0.0 /100 | #332 | Tragic $67,792 |
| Creek | 0.0 /100 | #333 | Tragic $67,715 |
| Blacks/African Americans | 0.0 /100 | #334 | Tragic $67,573 |
| Cheyenne | 0.0 /100 | #335 | Tragic $66,974 |
| Immigrants | Congo | 0.0 /100 | #336 | Tragic $66,768 |
| Kiowa | 0.0 /100 | #337 | Tragic $65,914 |
| Immigrants | Yemen | 0.0 /100 | #338 | Tragic $65,194 |
| Hopi | 0.0 /100 | #339 | Tragic $65,043 |
| Pueblo | 0.0 /100 | #340 | Tragic $64,692 |
| Crow | 0.0 /100 | #341 | Tragic $63,681 |
| Pima | 0.0 /100 | #342 | Tragic $63,262 |
| Houma | 0.0 /100 | #343 | Tragic $62,575 |