Romanian vs Immigrants from South Africa Median Household Income
COMPARE
Romanian
Immigrants from South Africa
Median Household Income
Median Household Income Comparison
Romanians
Immigrants from South Africa
$91,994
MEDIAN HOUSEHOLD INCOME
98.8/ 100
METRIC RATING
89th/ 347
METRIC RANK
$95,800
MEDIAN HOUSEHOLD INCOME
99.9/ 100
METRIC RATING
52nd/ 347
METRIC RANK
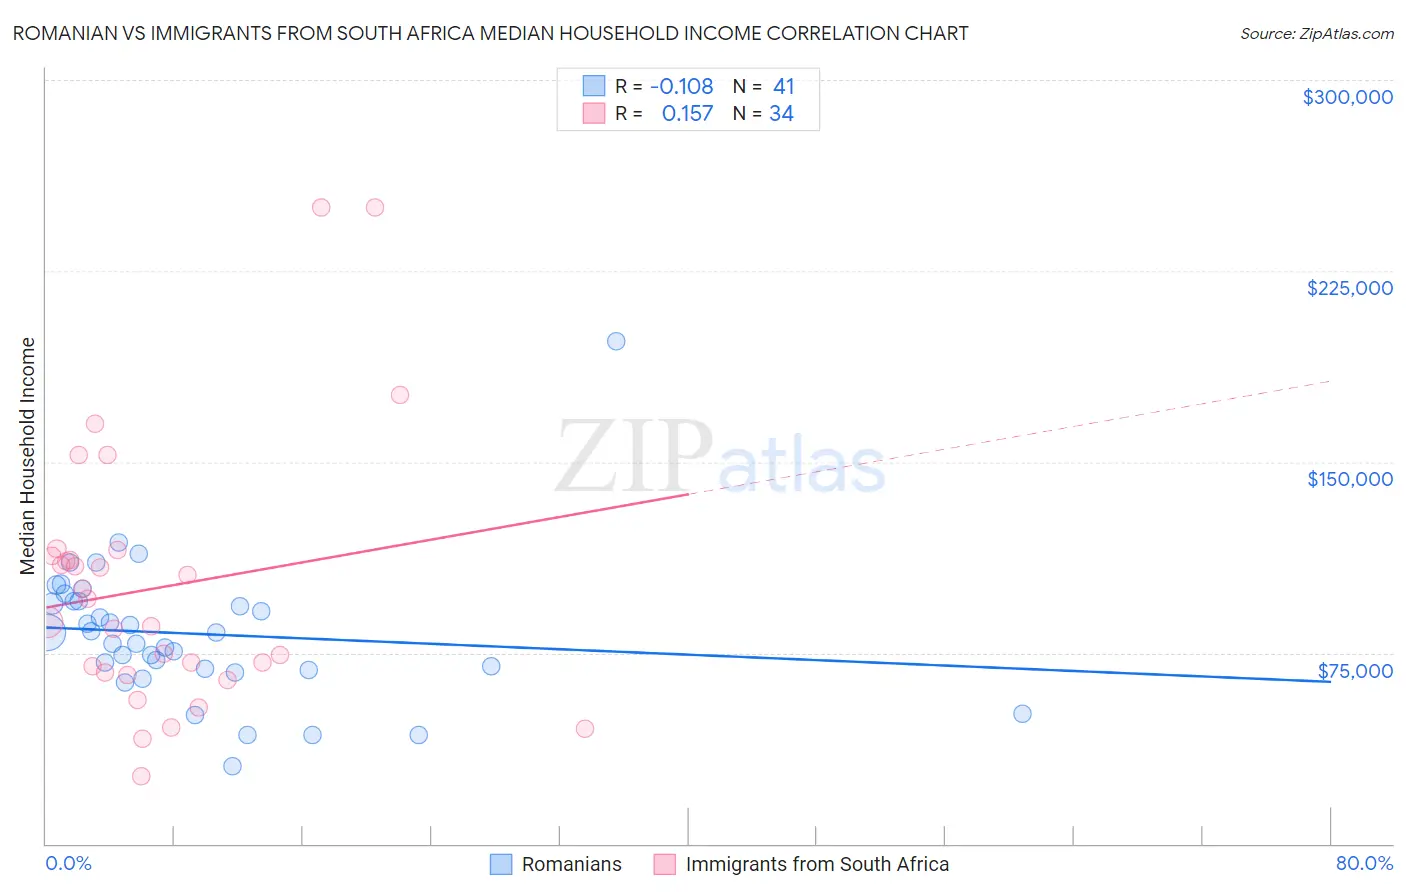
Romanian vs Immigrants from South Africa Median Household Income Correlation Chart
The statistical analysis conducted on geographies consisting of 377,637,037 people shows a poor negative correlation between the proportion of Romanians and median household income in the United States with a correlation coefficient (R) of -0.108 and weighted average of $91,994. Similarly, the statistical analysis conducted on geographies consisting of 233,255,435 people shows a poor positive correlation between the proportion of Immigrants from South Africa and median household income in the United States with a correlation coefficient (R) of 0.157 and weighted average of $95,800, a difference of 4.1%.
Median Household Income Correlation Summary
| Measurement | Romanian | Immigrants from South Africa |
| Minimum | $30,320 | $26,321 |
| Maximum | $197,500 | $250,001 |
| Range | $167,180 | $223,680 |
| Mean | $82,526 | $100,741 |
| Median | $82,785 | $91,620 |
| Interquartile 25% (IQ1) | $68,581 | $67,153 |
| Interquartile 75% (IQ3) | $95,353 | $112,945 |
| Interquartile Range (IQR) | $26,772 | $45,792 |
| Standard Deviation (Sample) | $27,672 | $51,810 |
| Standard Deviation (Population) | $27,332 | $51,042 |
Similar Demographics by Median Household Income
Demographics Similar to Romanians by Median Household Income
In terms of median household income, the demographic groups most similar to Romanians are Assyrian/Chaldean/Syriac ($91,991, a difference of 0.0%), Immigrants from Vietnam ($91,987, a difference of 0.010%), Immigrants from Canada ($92,029, a difference of 0.040%), Immigrants from Western Europe ($91,936, a difference of 0.060%), and Immigrants from England ($92,098, a difference of 0.11%).
| Demographics | Rating | Rank | Median Household Income |
| Immigrants | Spain | 99.3 /100 | #82 | Exceptional $92,732 |
| Italians | 99.1 /100 | #83 | Exceptional $92,475 |
| Immigrants | Argentina | 99.1 /100 | #84 | Exceptional $92,417 |
| Immigrants | Croatia | 99.0 /100 | #85 | Exceptional $92,225 |
| Immigrants | England | 98.9 /100 | #86 | Exceptional $92,098 |
| Immigrants | Hungary | 98.9 /100 | #87 | Exceptional $92,094 |
| Immigrants | Canada | 98.8 /100 | #88 | Exceptional $92,029 |
| Romanians | 98.8 /100 | #89 | Exceptional $91,994 |
| Assyrians/Chaldeans/Syriacs | 98.8 /100 | #90 | Exceptional $91,991 |
| Immigrants | Vietnam | 98.8 /100 | #91 | Exceptional $91,987 |
| Immigrants | Western Europe | 98.8 /100 | #92 | Exceptional $91,936 |
| Immigrants | Lebanon | 98.7 /100 | #93 | Exceptional $91,887 |
| Immigrants | North America | 98.7 /100 | #94 | Exceptional $91,860 |
| Armenians | 98.7 /100 | #95 | Exceptional $91,807 |
| Jordanians | 98.7 /100 | #96 | Exceptional $91,794 |
Demographics Similar to Immigrants from South Africa by Median Household Income
In terms of median household income, the demographic groups most similar to Immigrants from South Africa are Paraguayan ($95,737, a difference of 0.070%), Egyptian ($95,673, a difference of 0.13%), Estonian ($95,930, a difference of 0.14%), Immigrants from Czechoslovakia ($95,319, a difference of 0.50%), and Immigrants from Malaysia ($96,292, a difference of 0.51%).
| Demographics | Rating | Rank | Median Household Income |
| Israelis | 99.9 /100 | #45 | Exceptional $96,552 |
| Australians | 99.9 /100 | #46 | Exceptional $96,490 |
| Immigrants | Russia | 99.9 /100 | #47 | Exceptional $96,378 |
| Cambodians | 99.9 /100 | #48 | Exceptional $96,324 |
| Immigrants | Malaysia | 99.9 /100 | #49 | Exceptional $96,292 |
| Bulgarians | 99.9 /100 | #50 | Exceptional $96,290 |
| Estonians | 99.9 /100 | #51 | Exceptional $95,930 |
| Immigrants | South Africa | 99.9 /100 | #52 | Exceptional $95,800 |
| Paraguayans | 99.9 /100 | #53 | Exceptional $95,737 |
| Egyptians | 99.9 /100 | #54 | Exceptional $95,673 |
| Immigrants | Czechoslovakia | 99.9 /100 | #55 | Exceptional $95,319 |
| Immigrants | Austria | 99.9 /100 | #56 | Exceptional $95,277 |
| New Zealanders | 99.8 /100 | #57 | Exceptional $95,146 |
| Soviet Union | 99.8 /100 | #58 | Exceptional $95,098 |
| Immigrants | Europe | 99.8 /100 | #59 | Exceptional $95,032 |