Romanian vs Immigrants from Romania Female Unemployment
COMPARE
Romanian
Immigrants from Romania
Female Unemployment
Female Unemployment Comparison
Romanians
Immigrants from Romania
5.0%
FEMALE UNEMPLOYMENT
95.9/ 100
METRIC RATING
92nd/ 347
METRIC RANK
5.1%
FEMALE UNEMPLOYMENT
88.1/ 100
METRIC RATING
120th/ 347
METRIC RANK
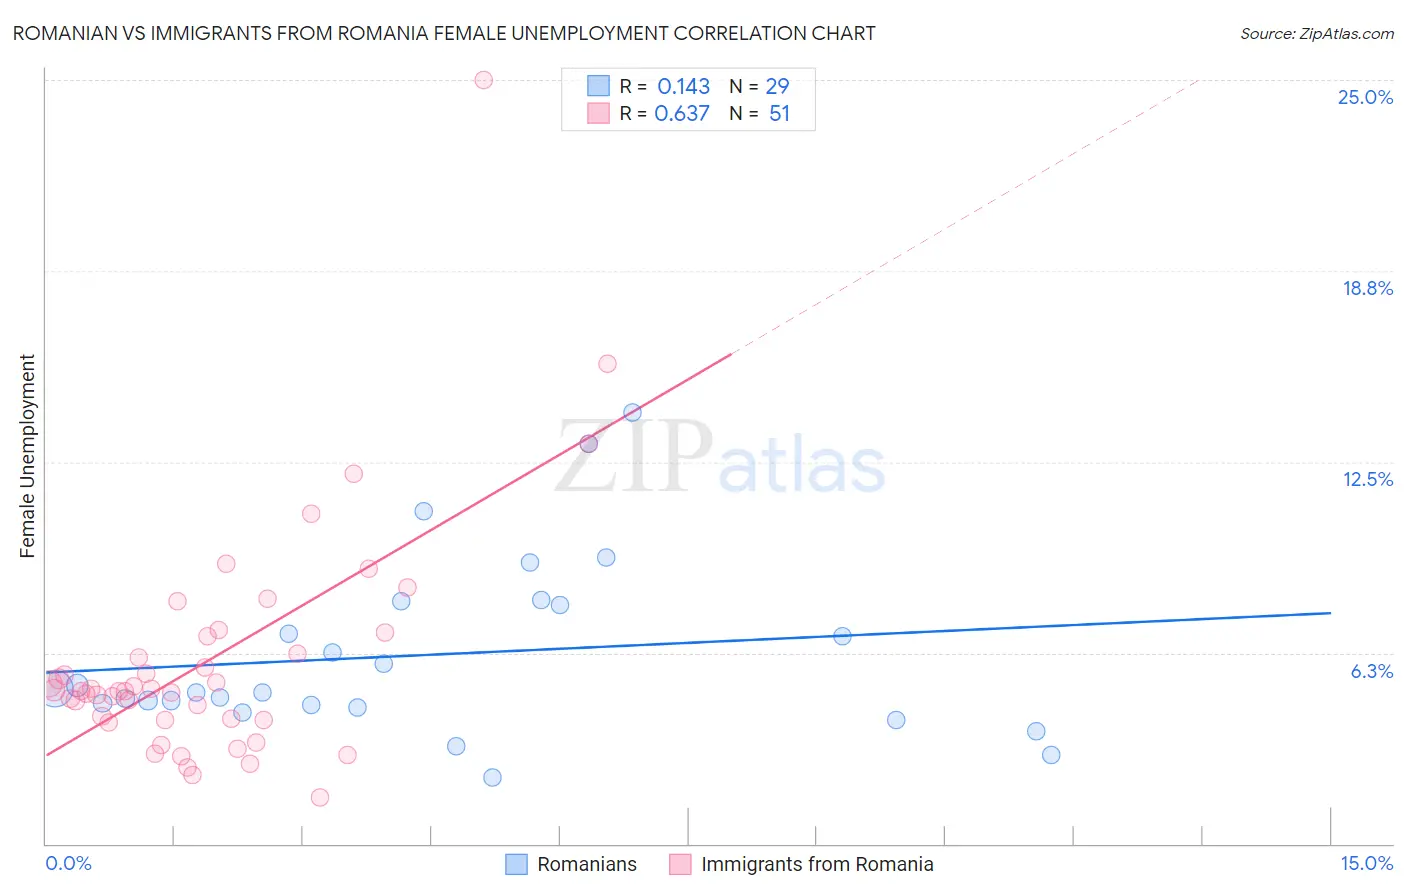
Romanian vs Immigrants from Romania Female Unemployment Correlation Chart
The statistical analysis conducted on geographies consisting of 376,152,929 people shows a poor positive correlation between the proportion of Romanians and unemploymnet rate among females in the United States with a correlation coefficient (R) of 0.143 and weighted average of 5.0%. Similarly, the statistical analysis conducted on geographies consisting of 256,484,740 people shows a significant positive correlation between the proportion of Immigrants from Romania and unemploymnet rate among females in the United States with a correlation coefficient (R) of 0.637 and weighted average of 5.1%, a difference of 1.8%.
Female Unemployment Correlation Summary
| Measurement | Romanian | Immigrants from Romania |
| Minimum | 2.1% | 1.5% |
| Maximum | 14.1% | 25.0% |
| Range | 12.0% | 23.5% |
| Mean | 6.2% | 6.0% |
| Median | 5.0% | 5.0% |
| Interquartile 25% (IQ1) | 4.5% | 4.0% |
| Interquartile 75% (IQ3) | 7.9% | 6.8% |
| Interquartile Range (IQR) | 3.4% | 2.7% |
| Standard Deviation (Sample) | 2.9% | 3.9% |
| Standard Deviation (Population) | 2.8% | 3.8% |
Similar Demographics by Female Unemployment
Demographics Similar to Romanians by Female Unemployment
In terms of female unemployment, the demographic groups most similar to Romanians are Immigrants from Japan (5.0%, a difference of 0.030%), Immigrants from Austria (5.0%, a difference of 0.080%), Immigrants from Malaysia (5.0%, a difference of 0.10%), Burmese (5.0%, a difference of 0.12%), and Immigrants from Sweden (5.0%, a difference of 0.14%).
| Demographics | Rating | Rank | Female Unemployment |
| Ukrainians | 97.1 /100 | #85 | Exceptional 5.0% |
| Bolivians | 97.1 /100 | #86 | Exceptional 5.0% |
| Venezuelans | 96.9 /100 | #87 | Exceptional 5.0% |
| Immigrants | Sudan | 96.7 /100 | #88 | Exceptional 5.0% |
| Immigrants | Taiwan | 96.6 /100 | #89 | Exceptional 5.0% |
| Immigrants | Sweden | 96.3 /100 | #90 | Exceptional 5.0% |
| Immigrants | Japan | 96.0 /100 | #91 | Exceptional 5.0% |
| Romanians | 95.9 /100 | #92 | Exceptional 5.0% |
| Immigrants | Austria | 95.7 /100 | #93 | Exceptional 5.0% |
| Immigrants | Malaysia | 95.7 /100 | #94 | Exceptional 5.0% |
| Burmese | 95.6 /100 | #95 | Exceptional 5.0% |
| Immigrants | South Central Asia | 95.5 /100 | #96 | Exceptional 5.0% |
| Immigrants | Somalia | 95.2 /100 | #97 | Exceptional 5.0% |
| Immigrants | Kuwait | 95.2 /100 | #98 | Exceptional 5.0% |
| Immigrants | Zaire | 95.2 /100 | #99 | Exceptional 5.0% |
Demographics Similar to Immigrants from Romania by Female Unemployment
In terms of female unemployment, the demographic groups most similar to Immigrants from Romania are Immigrants from Western Europe (5.1%, a difference of 0.0%), Immigrants from North Macedonia (5.1%, a difference of 0.020%), Immigrants from Germany (5.1%, a difference of 0.080%), Immigrants from South Africa (5.1%, a difference of 0.080%), and Immigrants from Europe (5.1%, a difference of 0.13%).
| Demographics | Rating | Rank | Female Unemployment |
| Immigrants | Saudi Arabia | 91.2 /100 | #113 | Exceptional 5.1% |
| Immigrants | Turkey | 91.0 /100 | #114 | Exceptional 5.1% |
| Lebanese | 91.0 /100 | #115 | Exceptional 5.1% |
| Americans | 90.5 /100 | #116 | Exceptional 5.1% |
| Jordanians | 90.3 /100 | #117 | Exceptional 5.1% |
| Immigrants | Croatia | 89.9 /100 | #118 | Excellent 5.1% |
| Immigrants | North Macedonia | 88.3 /100 | #119 | Excellent 5.1% |
| Immigrants | Romania | 88.1 /100 | #120 | Excellent 5.1% |
| Immigrants | Western Europe | 88.1 /100 | #121 | Excellent 5.1% |
| Immigrants | Germany | 87.6 /100 | #122 | Excellent 5.1% |
| Immigrants | South Africa | 87.6 /100 | #123 | Excellent 5.1% |
| Immigrants | Europe | 87.2 /100 | #124 | Excellent 5.1% |
| Basques | 86.5 /100 | #125 | Excellent 5.1% |
| Immigrants | Korea | 86.3 /100 | #126 | Excellent 5.1% |
| Immigrants | Hungary | 86.0 /100 | #127 | Excellent 5.1% |