Romanian vs Liberian Median Household Income
COMPARE
Romanian
Liberian
Median Household Income
Median Household Income Comparison
Romanians
Liberians
$91,994
MEDIAN HOUSEHOLD INCOME
98.8/ 100
METRIC RATING
89th/ 347
METRIC RANK
$75,667
MEDIAN HOUSEHOLD INCOME
0.2/ 100
METRIC RATING
273rd/ 347
METRIC RANK
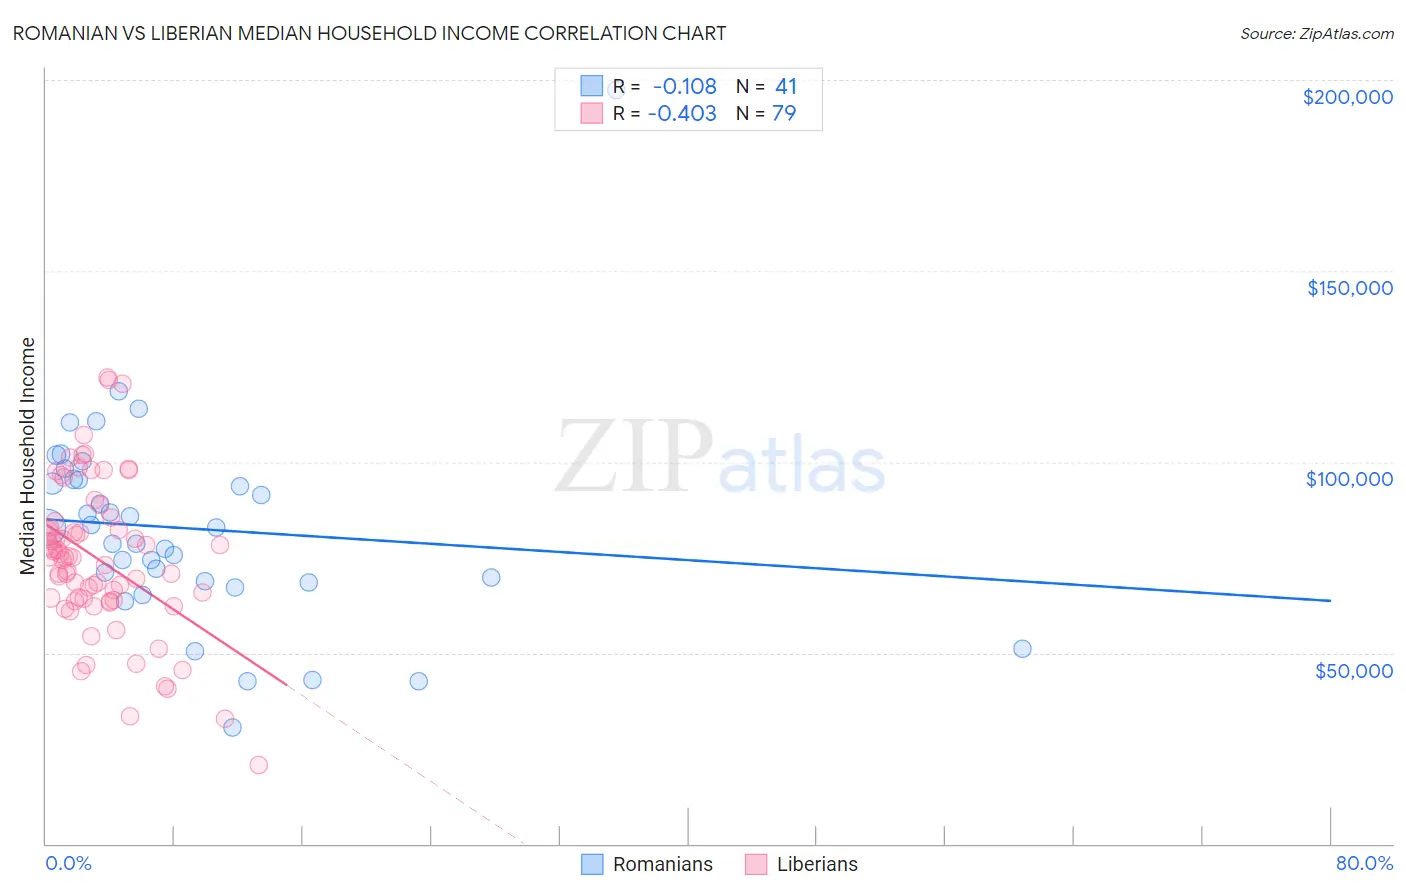
Romanian vs Liberian Median Household Income Correlation Chart
The statistical analysis conducted on geographies consisting of 377,637,037 people shows a poor negative correlation between the proportion of Romanians and median household income in the United States with a correlation coefficient (R) of -0.108 and weighted average of $91,994. Similarly, the statistical analysis conducted on geographies consisting of 118,026,657 people shows a moderate negative correlation between the proportion of Liberians and median household income in the United States with a correlation coefficient (R) of -0.403 and weighted average of $75,667, a difference of 21.6%.
Median Household Income Correlation Summary
| Measurement | Romanian | Liberian |
| Minimum | $30,320 | $20,699 |
| Maximum | $197,500 | $122,146 |
| Range | $167,180 | $101,447 |
| Mean | $82,526 | $74,517 |
| Median | $82,785 | $74,984 |
| Interquartile 25% (IQ1) | $68,581 | $63,718 |
| Interquartile 75% (IQ3) | $95,353 | $82,932 |
| Interquartile Range (IQR) | $26,772 | $19,214 |
| Standard Deviation (Sample) | $27,672 | $19,716 |
| Standard Deviation (Population) | $27,332 | $19,591 |
Similar Demographics by Median Household Income
Demographics Similar to Romanians by Median Household Income
In terms of median household income, the demographic groups most similar to Romanians are Assyrian/Chaldean/Syriac ($91,991, a difference of 0.0%), Immigrants from Vietnam ($91,987, a difference of 0.010%), Immigrants from Canada ($92,029, a difference of 0.040%), Immigrants from Western Europe ($91,936, a difference of 0.060%), and Immigrants from England ($92,098, a difference of 0.11%).
| Demographics | Rating | Rank | Median Household Income |
| Immigrants | Spain | 99.3 /100 | #82 | Exceptional $92,732 |
| Italians | 99.1 /100 | #83 | Exceptional $92,475 |
| Immigrants | Argentina | 99.1 /100 | #84 | Exceptional $92,417 |
| Immigrants | Croatia | 99.0 /100 | #85 | Exceptional $92,225 |
| Immigrants | England | 98.9 /100 | #86 | Exceptional $92,098 |
| Immigrants | Hungary | 98.9 /100 | #87 | Exceptional $92,094 |
| Immigrants | Canada | 98.8 /100 | #88 | Exceptional $92,029 |
| Romanians | 98.8 /100 | #89 | Exceptional $91,994 |
| Assyrians/Chaldeans/Syriacs | 98.8 /100 | #90 | Exceptional $91,991 |
| Immigrants | Vietnam | 98.8 /100 | #91 | Exceptional $91,987 |
| Immigrants | Western Europe | 98.8 /100 | #92 | Exceptional $91,936 |
| Immigrants | Lebanon | 98.7 /100 | #93 | Exceptional $91,887 |
| Immigrants | North America | 98.7 /100 | #94 | Exceptional $91,860 |
| Armenians | 98.7 /100 | #95 | Exceptional $91,807 |
| Jordanians | 98.7 /100 | #96 | Exceptional $91,794 |
Demographics Similar to Liberians by Median Household Income
In terms of median household income, the demographic groups most similar to Liberians are British West Indian ($75,647, a difference of 0.030%), Immigrants from Micronesia ($75,574, a difference of 0.12%), Somali ($75,782, a difference of 0.15%), Pennsylvania German ($75,814, a difference of 0.19%), and Hmong ($75,839, a difference of 0.23%).
| Demographics | Rating | Rank | Median Household Income |
| Americans | 0.3 /100 | #266 | Tragic $75,932 |
| German Russians | 0.3 /100 | #267 | Tragic $75,856 |
| Immigrants | Jamaica | 0.3 /100 | #268 | Tragic $75,851 |
| Cape Verdeans | 0.3 /100 | #269 | Tragic $75,848 |
| Hmong | 0.3 /100 | #270 | Tragic $75,839 |
| Pennsylvania Germans | 0.3 /100 | #271 | Tragic $75,814 |
| Somalis | 0.3 /100 | #272 | Tragic $75,782 |
| Liberians | 0.2 /100 | #273 | Tragic $75,667 |
| British West Indians | 0.2 /100 | #274 | Tragic $75,647 |
| Immigrants | Micronesia | 0.2 /100 | #275 | Tragic $75,574 |
| Immigrants | Latin America | 0.2 /100 | #276 | Tragic $75,420 |
| Spanish Americans | 0.2 /100 | #277 | Tragic $75,386 |
| Osage | 0.2 /100 | #278 | Tragic $75,240 |
| Immigrants | Guatemala | 0.2 /100 | #279 | Tragic $75,123 |
| Senegalese | 0.2 /100 | #280 | Tragic $74,999 |