Yugoslavian vs Immigrants from Northern Europe Median Family Income
COMPARE
Yugoslavian
Immigrants from Northern Europe
Median Family Income
Median Family Income Comparison
Yugoslavians
Immigrants from Northern Europe
$100,119
MEDIAN FAMILY INCOME
21.3/ 100
METRIC RATING
199th/ 347
METRIC RANK
$121,840
MEDIAN FAMILY INCOME
100.0/ 100
METRIC RATING
24th/ 347
METRIC RANK
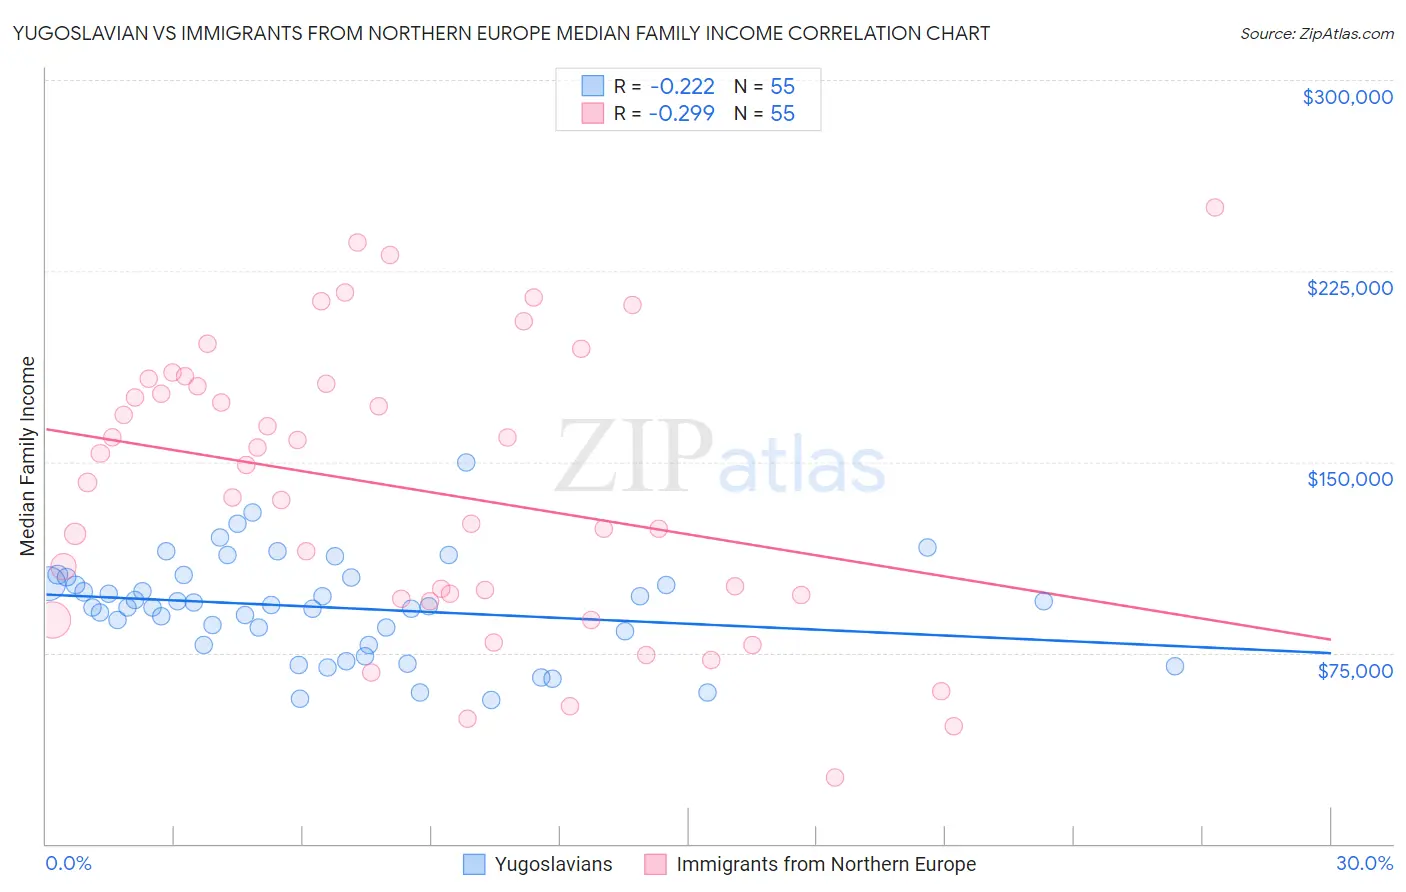
Yugoslavian vs Immigrants from Northern Europe Median Family Income Correlation Chart
The statistical analysis conducted on geographies consisting of 285,576,130 people shows a weak negative correlation between the proportion of Yugoslavians and median family income in the United States with a correlation coefficient (R) of -0.222 and weighted average of $100,119. Similarly, the statistical analysis conducted on geographies consisting of 476,742,479 people shows a weak negative correlation between the proportion of Immigrants from Northern Europe and median family income in the United States with a correlation coefficient (R) of -0.299 and weighted average of $121,840, a difference of 21.7%.
Median Family Income Correlation Summary
| Measurement | Yugoslavian | Immigrants from Northern Europe |
| Minimum | $56,660 | $26,250 |
| Maximum | $150,000 | $250,001 |
| Range | $93,340 | $223,751 |
| Mean | $92,781 | $139,082 |
| Median | $93,214 | $142,088 |
| Interquartile 25% (IQ1) | $78,167 | $96,250 |
| Interquartile 75% (IQ3) | $104,589 | $180,658 |
| Interquartile Range (IQR) | $26,422 | $84,408 |
| Standard Deviation (Sample) | $19,367 | $55,193 |
| Standard Deviation (Population) | $19,191 | $54,689 |
Similar Demographics by Median Family Income
Demographics Similar to Yugoslavians by Median Family Income
In terms of median family income, the demographic groups most similar to Yugoslavians are Immigrants from Africa ($100,256, a difference of 0.14%), Spanish ($99,977, a difference of 0.14%), Immigrants from Cameroon ($100,289, a difference of 0.17%), Samoan ($100,344, a difference of 0.22%), and Immigrants from Thailand ($99,840, a difference of 0.28%).
| Demographics | Rating | Rank | Median Family Income |
| Immigrants | Kenya | 26.5 /100 | #192 | Fair $100,679 |
| Iraqis | 26.3 /100 | #193 | Fair $100,658 |
| Uruguayans | 26.3 /100 | #194 | Fair $100,656 |
| Immigrants | South America | 23.9 /100 | #195 | Fair $100,414 |
| Samoans | 23.3 /100 | #196 | Fair $100,344 |
| Immigrants | Cameroon | 22.8 /100 | #197 | Fair $100,289 |
| Immigrants | Africa | 22.5 /100 | #198 | Fair $100,256 |
| Yugoslavians | 21.3 /100 | #199 | Fair $100,119 |
| Spanish | 20.1 /100 | #200 | Fair $99,977 |
| Immigrants | Thailand | 19.0 /100 | #201 | Poor $99,840 |
| Whites/Caucasians | 18.7 /100 | #202 | Poor $99,800 |
| Scotch-Irish | 17.1 /100 | #203 | Poor $99,591 |
| Ghanaians | 12.6 /100 | #204 | Poor $98,877 |
| Hawaiians | 12.5 /100 | #205 | Poor $98,869 |
| Immigrants | Iraq | 12.1 /100 | #206 | Poor $98,786 |
Demographics Similar to Immigrants from Northern Europe by Median Family Income
In terms of median family income, the demographic groups most similar to Immigrants from Northern Europe are Turkish ($121,202, a difference of 0.53%), Immigrants from Sweden ($122,765, a difference of 0.76%), Immigrants from Japan ($122,764, a difference of 0.76%), Immigrants from Korea ($122,800, a difference of 0.79%), and Immigrants from Switzerland ($120,726, a difference of 0.92%).
| Demographics | Rating | Rank | Median Family Income |
| Indians (Asian) | 100.0 /100 | #17 | Exceptional $125,312 |
| Immigrants | Eastern Asia | 100.0 /100 | #18 | Exceptional $125,150 |
| Immigrants | Belgium | 100.0 /100 | #19 | Exceptional $123,831 |
| Burmese | 100.0 /100 | #20 | Exceptional $123,369 |
| Immigrants | Korea | 100.0 /100 | #21 | Exceptional $122,800 |
| Immigrants | Sweden | 100.0 /100 | #22 | Exceptional $122,765 |
| Immigrants | Japan | 100.0 /100 | #23 | Exceptional $122,764 |
| Immigrants | Northern Europe | 100.0 /100 | #24 | Exceptional $121,840 |
| Turks | 100.0 /100 | #25 | Exceptional $121,202 |
| Immigrants | Switzerland | 100.0 /100 | #26 | Exceptional $120,726 |
| Russians | 100.0 /100 | #27 | Exceptional $120,487 |
| Immigrants | Denmark | 100.0 /100 | #28 | Exceptional $120,445 |
| Latvians | 100.0 /100 | #29 | Exceptional $120,301 |
| Immigrants | Sri Lanka | 100.0 /100 | #30 | Exceptional $120,263 |
| Immigrants | France | 100.0 /100 | #31 | Exceptional $120,076 |