Romanian vs Immigrants from Bulgaria In Labor Force | Age 30-34
COMPARE
Romanian
Immigrants from Bulgaria
In Labor Force | Age 30-34
In Labor Force | Age 30-34 Comparison
Romanians
Immigrants from Bulgaria
84.8%
IN LABOR FORCE | AGE 30-34
73.5/ 100
METRIC RATING
152nd/ 347
METRIC RANK
86.0%
IN LABOR FORCE | AGE 30-34
100.0/ 100
METRIC RATING
21st/ 347
METRIC RANK
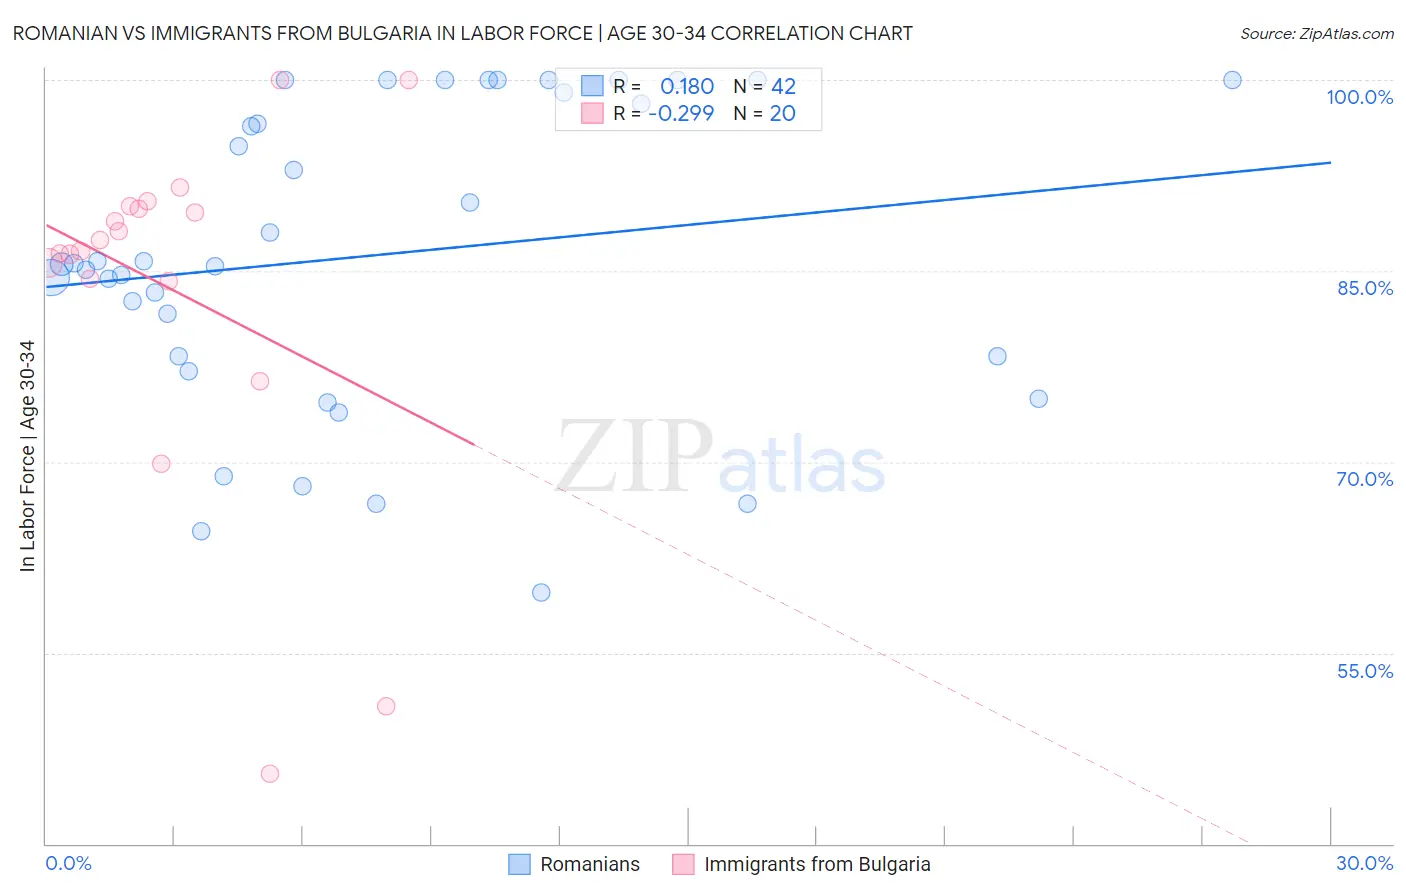
Romanian vs Immigrants from Bulgaria In Labor Force | Age 30-34 Correlation Chart
The statistical analysis conducted on geographies consisting of 377,700,007 people shows a poor positive correlation between the proportion of Romanians and labor force participation rate among population between the ages 30 and 34 in the United States with a correlation coefficient (R) of 0.180 and weighted average of 84.8%. Similarly, the statistical analysis conducted on geographies consisting of 172,547,682 people shows a weak negative correlation between the proportion of Immigrants from Bulgaria and labor force participation rate among population between the ages 30 and 34 in the United States with a correlation coefficient (R) of -0.299 and weighted average of 86.0%, a difference of 1.3%.
In Labor Force | Age 30-34 Correlation Summary
| Measurement | Romanian | Immigrants from Bulgaria |
| Minimum | 59.7% | 45.5% |
| Maximum | 100.0% | 100.0% |
| Range | 40.3% | 54.5% |
| Mean | 86.2% | 83.6% |
| Median | 85.6% | 87.0% |
| Interquartile 25% (IQ1) | 78.3% | 84.3% |
| Interquartile 75% (IQ3) | 99.0% | 90.0% |
| Interquartile Range (IQR) | 20.7% | 5.7% |
| Standard Deviation (Sample) | 11.9% | 13.8% |
| Standard Deviation (Population) | 11.7% | 13.5% |
Similar Demographics by In Labor Force | Age 30-34
Demographics Similar to Romanians by In Labor Force | Age 30-34
In terms of in labor force | age 30-34, the demographic groups most similar to Romanians are Immigrants from Senegal (84.8%, a difference of 0.0%), German (84.8%, a difference of 0.010%), Immigrants from Ukraine (84.8%, a difference of 0.020%), Immigrants from Saudi Arabia (84.9%, a difference of 0.030%), and Immigrants from Colombia (84.9%, a difference of 0.030%).
| Demographics | Rating | Rank | In Labor Force | Age 30-34 |
| Palestinians | 77.7 /100 | #145 | Good 84.9% |
| Immigrants | Saudi Arabia | 76.6 /100 | #146 | Good 84.9% |
| Immigrants | Colombia | 76.3 /100 | #147 | Good 84.9% |
| Immigrants | Pakistan | 76.2 /100 | #148 | Good 84.9% |
| Immigrants | Ukraine | 75.1 /100 | #149 | Good 84.8% |
| Germans | 75.1 /100 | #150 | Good 84.8% |
| Immigrants | Senegal | 74.0 /100 | #151 | Good 84.8% |
| Romanians | 73.5 /100 | #152 | Good 84.8% |
| Syrians | 70.1 /100 | #153 | Good 84.8% |
| Northern Europeans | 70.0 /100 | #154 | Good 84.8% |
| Immigrants | Sudan | 69.5 /100 | #155 | Good 84.8% |
| French Canadians | 67.3 /100 | #156 | Good 84.8% |
| Peruvians | 65.9 /100 | #157 | Good 84.8% |
| Immigrants | Armenia | 64.7 /100 | #158 | Good 84.8% |
| Czechoslovakians | 63.0 /100 | #159 | Good 84.8% |
Demographics Similar to Immigrants from Bulgaria by In Labor Force | Age 30-34
In terms of in labor force | age 30-34, the demographic groups most similar to Immigrants from Bulgaria are Bulgarian (86.0%, a difference of 0.0%), Sierra Leonean (86.0%, a difference of 0.010%), Bermudan (85.9%, a difference of 0.020%), Estonian (85.9%, a difference of 0.030%), and Immigrants from Eritrea (85.9%, a difference of 0.040%).
| Demographics | Rating | Rank | In Labor Force | Age 30-34 |
| Immigrants | Cabo Verde | 100.0 /100 | #14 | Exceptional 86.1% |
| Immigrants | Albania | 100.0 /100 | #15 | Exceptional 86.1% |
| Latvians | 100.0 /100 | #16 | Exceptional 86.0% |
| Immigrants | Cameroon | 100.0 /100 | #17 | Exceptional 86.0% |
| Immigrants | Sierra Leone | 100.0 /100 | #18 | Exceptional 86.0% |
| Sierra Leoneans | 100.0 /100 | #19 | Exceptional 86.0% |
| Bulgarians | 100.0 /100 | #20 | Exceptional 86.0% |
| Immigrants | Bulgaria | 100.0 /100 | #21 | Exceptional 86.0% |
| Bermudans | 100.0 /100 | #22 | Exceptional 85.9% |
| Estonians | 100.0 /100 | #23 | Exceptional 85.9% |
| Immigrants | Eritrea | 100.0 /100 | #24 | Exceptional 85.9% |
| Immigrants | North Macedonia | 100.0 /100 | #25 | Exceptional 85.9% |
| Immigrants | Eastern Africa | 100.0 /100 | #26 | Exceptional 85.9% |
| Immigrants | Liberia | 100.0 /100 | #27 | Exceptional 85.9% |
| Immigrants | Latvia | 100.0 /100 | #28 | Exceptional 85.9% |