Swiss vs Immigrants from Bulgaria Median Family Income
COMPARE
Swiss
Immigrants from Bulgaria
Median Family Income
Median Family Income Comparison
Swiss
Immigrants from Bulgaria
$104,396
MEDIAN FAMILY INCOME
70.7/ 100
METRIC RATING
159th/ 347
METRIC RANK
$113,461
MEDIAN FAMILY INCOME
99.6/ 100
METRIC RATING
69th/ 347
METRIC RANK
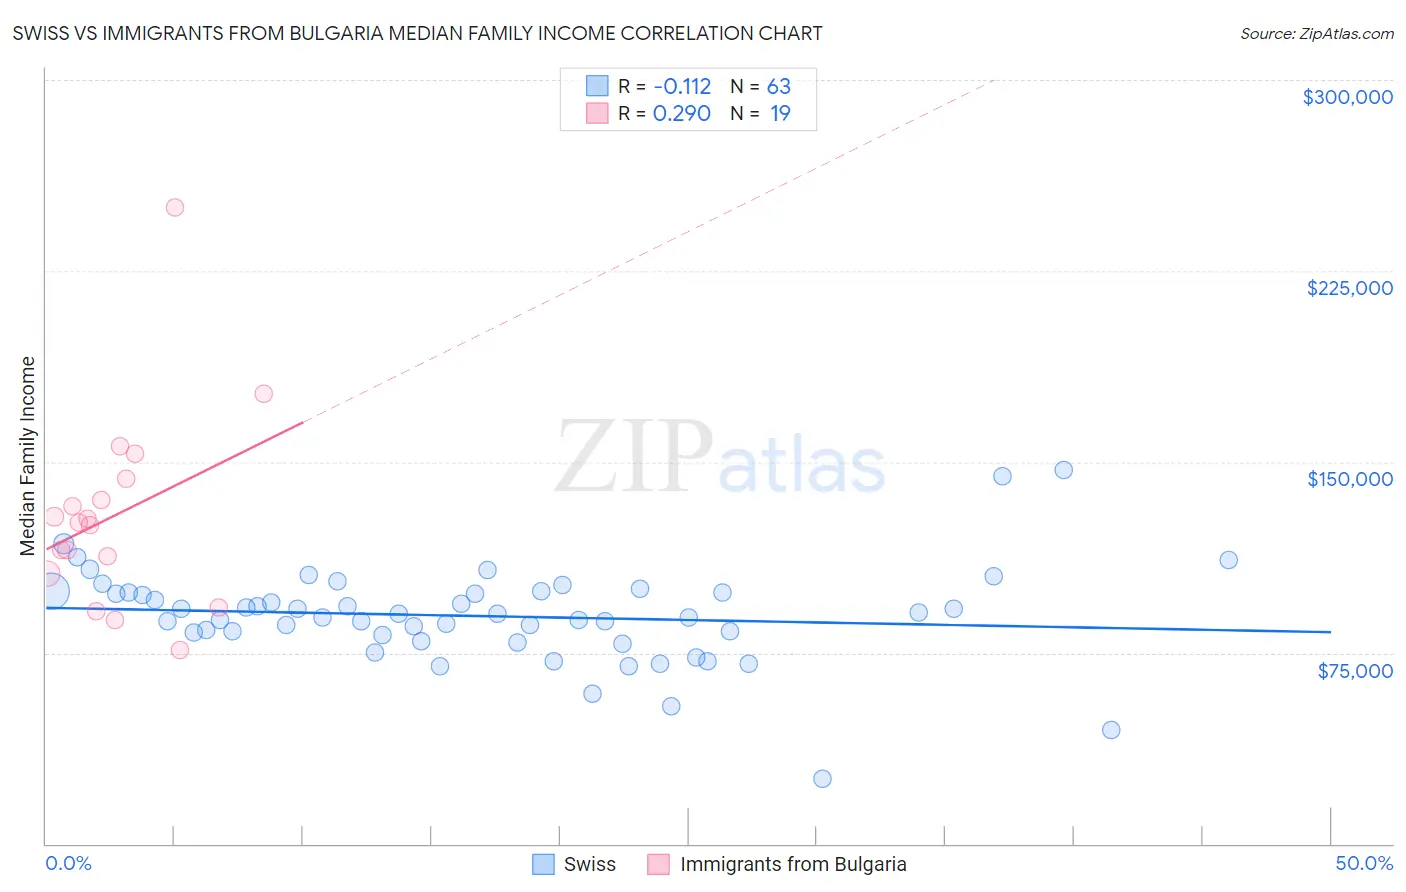
Swiss vs Immigrants from Bulgaria Median Family Income Correlation Chart
The statistical analysis conducted on geographies consisting of 464,558,670 people shows a poor negative correlation between the proportion of Swiss and median family income in the United States with a correlation coefficient (R) of -0.112 and weighted average of $104,396. Similarly, the statistical analysis conducted on geographies consisting of 172,528,300 people shows a weak positive correlation between the proportion of Immigrants from Bulgaria and median family income in the United States with a correlation coefficient (R) of 0.290 and weighted average of $113,461, a difference of 8.7%.
Median Family Income Correlation Summary
| Measurement | Swiss | Immigrants from Bulgaria |
| Minimum | $25,401 | $76,250 |
| Maximum | $146,603 | $250,001 |
| Range | $121,202 | $173,751 |
| Mean | $89,459 | $129,116 |
| Median | $90,414 | $126,024 |
| Interquartile 25% (IQ1) | $81,791 | $106,034 |
| Interquartile 75% (IQ3) | $98,522 | $143,482 |
| Interquartile Range (IQR) | $16,731 | $37,448 |
| Standard Deviation (Sample) | $18,875 | $38,648 |
| Standard Deviation (Population) | $18,724 | $37,618 |
Similar Demographics by Median Family Income
Demographics Similar to Swiss by Median Family Income
In terms of median family income, the demographic groups most similar to Swiss are Scandinavian ($104,410, a difference of 0.010%), Moroccan ($104,488, a difference of 0.090%), Scottish ($104,288, a difference of 0.10%), Icelander ($104,282, a difference of 0.11%), and Basque ($104,760, a difference of 0.35%).
| Demographics | Rating | Rank | Median Family Income |
| Immigrants | Albania | 79.1 /100 | #152 | Good $105,285 |
| Slavs | 77.9 /100 | #153 | Good $105,144 |
| Immigrants | Nepal | 76.3 /100 | #154 | Good $104,966 |
| Native Hawaiians | 75.8 /100 | #155 | Good $104,910 |
| Basques | 74.4 /100 | #156 | Good $104,760 |
| Moroccans | 71.6 /100 | #157 | Good $104,488 |
| Scandinavians | 70.8 /100 | #158 | Good $104,410 |
| Swiss | 70.7 /100 | #159 | Good $104,396 |
| Scottish | 69.5 /100 | #160 | Good $104,288 |
| Icelanders | 69.4 /100 | #161 | Good $104,282 |
| Immigrants | Sierra Leone | 66.2 /100 | #162 | Good $103,990 |
| Costa Ricans | 66.2 /100 | #163 | Good $103,989 |
| Sierra Leoneans | 64.7 /100 | #164 | Good $103,859 |
| Slovaks | 63.1 /100 | #165 | Good $103,729 |
| English | 62.6 /100 | #166 | Good $103,684 |
Demographics Similar to Immigrants from Bulgaria by Median Family Income
In terms of median family income, the demographic groups most similar to Immigrants from Bulgaria are Immigrants from Serbia ($113,463, a difference of 0.0%), Immigrants from Romania ($113,434, a difference of 0.020%), South African ($113,229, a difference of 0.20%), Immigrants from Spain ($113,815, a difference of 0.31%), and Afghan ($112,971, a difference of 0.43%).
| Demographics | Rating | Rank | Median Family Income |
| Mongolians | 99.8 /100 | #62 | Exceptional $114,553 |
| Immigrants | Pakistan | 99.8 /100 | #63 | Exceptional $114,406 |
| Immigrants | Scotland | 99.7 /100 | #64 | Exceptional $114,392 |
| Egyptians | 99.7 /100 | #65 | Exceptional $114,119 |
| Paraguayans | 99.7 /100 | #66 | Exceptional $114,016 |
| Immigrants | Spain | 99.7 /100 | #67 | Exceptional $113,815 |
| Immigrants | Serbia | 99.6 /100 | #68 | Exceptional $113,463 |
| Immigrants | Bulgaria | 99.6 /100 | #69 | Exceptional $113,461 |
| Immigrants | Romania | 99.6 /100 | #70 | Exceptional $113,434 |
| South Africans | 99.5 /100 | #71 | Exceptional $113,229 |
| Afghans | 99.5 /100 | #72 | Exceptional $112,971 |
| Laotians | 99.5 /100 | #73 | Exceptional $112,859 |
| Immigrants | Italy | 99.4 /100 | #74 | Exceptional $112,848 |
| Immigrants | Western Europe | 99.4 /100 | #75 | Exceptional $112,688 |
| Argentineans | 99.4 /100 | #76 | Exceptional $112,665 |