Serbian vs Immigrants from Bolivia Median Family Income
COMPARE
Serbian
Immigrants from Bolivia
Median Family Income
Median Family Income Comparison
Serbians
Immigrants from Bolivia
$107,157
MEDIAN FAMILY INCOME
90.8/ 100
METRIC RATING
126th/ 347
METRIC RANK
$117,912
MEDIAN FAMILY INCOME
100.0/ 100
METRIC RATING
42nd/ 347
METRIC RANK
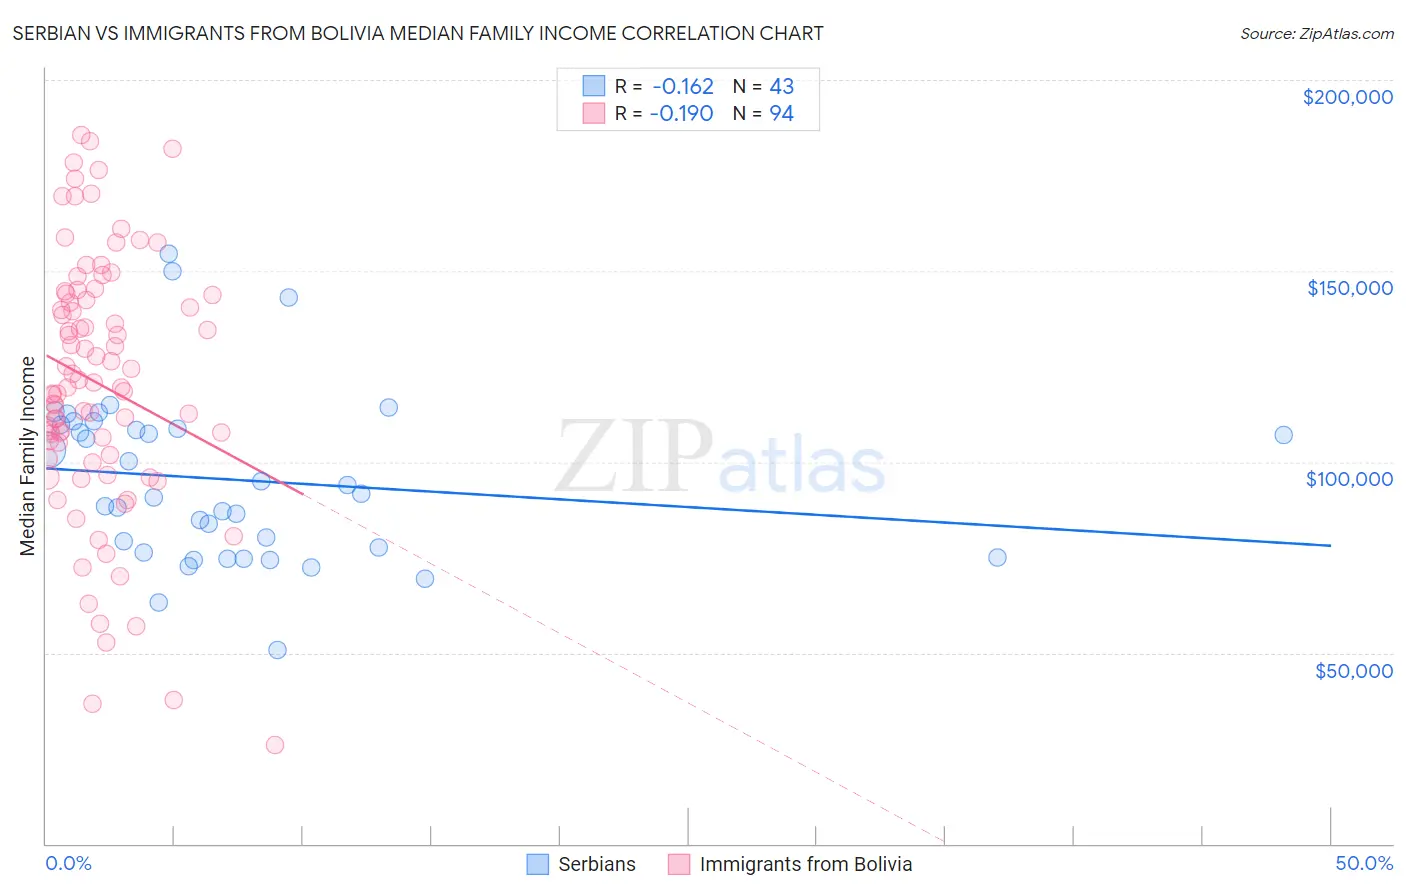
Serbian vs Immigrants from Bolivia Median Family Income Correlation Chart
The statistical analysis conducted on geographies consisting of 267,482,647 people shows a poor negative correlation between the proportion of Serbians and median family income in the United States with a correlation coefficient (R) of -0.162 and weighted average of $107,157. Similarly, the statistical analysis conducted on geographies consisting of 158,713,434 people shows a poor negative correlation between the proportion of Immigrants from Bolivia and median family income in the United States with a correlation coefficient (R) of -0.190 and weighted average of $117,912, a difference of 10.0%.
Median Family Income Correlation Summary
| Measurement | Serbian | Immigrants from Bolivia |
| Minimum | $50,679 | $25,703 |
| Maximum | $154,464 | $185,567 |
| Range | $103,785 | $159,864 |
| Mean | $95,313 | $120,434 |
| Median | $91,648 | $120,122 |
| Interquartile 25% (IQ1) | $76,245 | $101,733 |
| Interquartile 75% (IQ3) | $109,780 | $143,542 |
| Interquartile Range (IQR) | $33,535 | $41,809 |
| Standard Deviation (Sample) | $22,166 | $33,861 |
| Standard Deviation (Population) | $21,907 | $33,681 |
Similar Demographics by Median Family Income
Demographics Similar to Serbians by Median Family Income
In terms of median family income, the demographic groups most similar to Serbians are Lebanese ($107,086, a difference of 0.070%), Taiwanese ($107,295, a difference of 0.13%), Immigrants from Ethiopia ($106,969, a difference of 0.18%), Arab ($106,952, a difference of 0.19%), and Brazilian ($106,942, a difference of 0.20%).
| Demographics | Rating | Rank | Median Family Income |
| Sri Lankans | 94.5 /100 | #119 | Exceptional $108,234 |
| Immigrants | Northern Africa | 94.3 /100 | #120 | Exceptional $108,161 |
| Europeans | 94.1 /100 | #121 | Exceptional $108,099 |
| Immigrants | Jordan | 92.9 /100 | #122 | Exceptional $107,715 |
| Carpatho Rusyns | 92.2 /100 | #123 | Exceptional $107,502 |
| Pakistanis | 91.7 /100 | #124 | Exceptional $107,390 |
| Taiwanese | 91.4 /100 | #125 | Exceptional $107,295 |
| Serbians | 90.8 /100 | #126 | Exceptional $107,157 |
| Lebanese | 90.5 /100 | #127 | Exceptional $107,086 |
| Immigrants | Ethiopia | 90.0 /100 | #128 | Excellent $106,969 |
| Arabs | 89.9 /100 | #129 | Excellent $106,952 |
| Brazilians | 89.8 /100 | #130 | Excellent $106,942 |
| Canadians | 88.1 /100 | #131 | Excellent $106,597 |
| Immigrants | Fiji | 87.8 /100 | #132 | Excellent $106,544 |
| Ugandans | 87.8 /100 | #133 | Excellent $106,541 |
Demographics Similar to Immigrants from Bolivia by Median Family Income
In terms of median family income, the demographic groups most similar to Immigrants from Bolivia are Bulgarian ($117,818, a difference of 0.080%), Estonian ($118,013, a difference of 0.090%), Cambodian ($117,780, a difference of 0.11%), Immigrants from Lithuania ($118,053, a difference of 0.12%), and Immigrants from Asia ($118,291, a difference of 0.32%).
| Demographics | Rating | Rank | Median Family Income |
| Soviet Union | 100.0 /100 | #35 | Exceptional $119,262 |
| Israelis | 100.0 /100 | #36 | Exceptional $118,577 |
| Australians | 100.0 /100 | #37 | Exceptional $118,440 |
| Immigrants | Turkey | 100.0 /100 | #38 | Exceptional $118,325 |
| Immigrants | Asia | 100.0 /100 | #39 | Exceptional $118,291 |
| Immigrants | Lithuania | 100.0 /100 | #40 | Exceptional $118,053 |
| Estonians | 100.0 /100 | #41 | Exceptional $118,013 |
| Immigrants | Bolivia | 100.0 /100 | #42 | Exceptional $117,912 |
| Bulgarians | 100.0 /100 | #43 | Exceptional $117,818 |
| Cambodians | 100.0 /100 | #44 | Exceptional $117,780 |
| Immigrants | Greece | 99.9 /100 | #45 | Exceptional $117,344 |
| Immigrants | Russia | 99.9 /100 | #46 | Exceptional $116,942 |
| Immigrants | Austria | 99.9 /100 | #47 | Exceptional $116,830 |
| Immigrants | South Africa | 99.9 /100 | #48 | Exceptional $116,286 |
| Chinese | 99.9 /100 | #49 | Exceptional $116,188 |