Puget Sound Salish vs Immigrants from Serbia Median Earnings
COMPARE
Puget Sound Salish
Immigrants from Serbia
Median Earnings
Median Earnings Comparison
Puget Sound Salish
Immigrants from Serbia
$46,333
MEDIAN EARNINGS
46.5/ 100
METRIC RATING
180th/ 347
METRIC RANK
$51,557
MEDIAN EARNINGS
99.9/ 100
METRIC RATING
60th/ 347
METRIC RANK
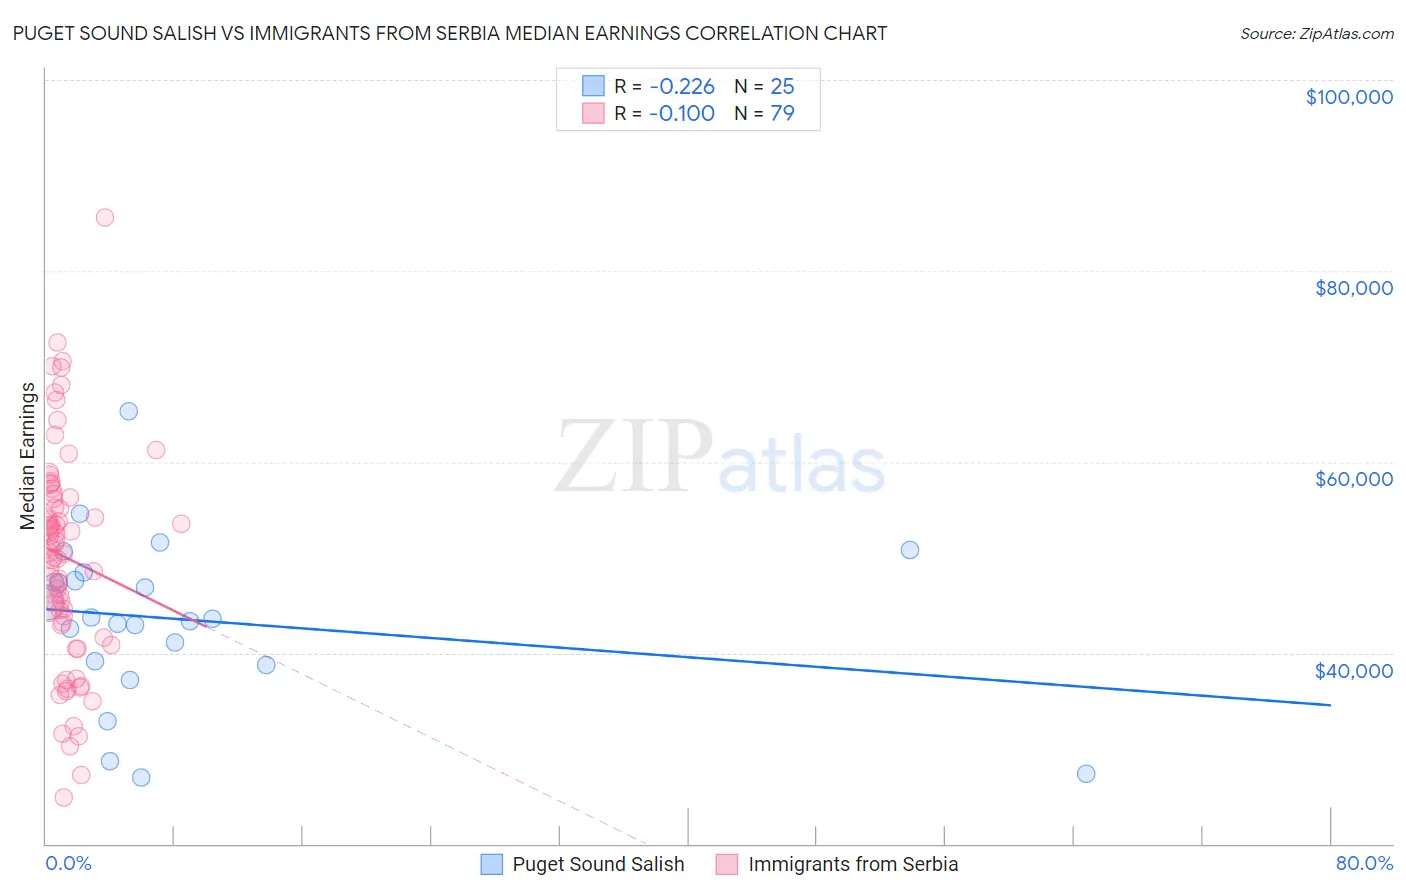
Puget Sound Salish vs Immigrants from Serbia Median Earnings Correlation Chart
The statistical analysis conducted on geographies consisting of 46,155,746 people shows a weak negative correlation between the proportion of Puget Sound Salish and median earnings in the United States with a correlation coefficient (R) of -0.226 and weighted average of $46,333. Similarly, the statistical analysis conducted on geographies consisting of 131,742,589 people shows a slight negative correlation between the proportion of Immigrants from Serbia and median earnings in the United States with a correlation coefficient (R) of -0.100 and weighted average of $51,557, a difference of 11.3%.
Median Earnings Correlation Summary
| Measurement | Puget Sound Salish | Immigrants from Serbia |
| Minimum | $26,875 | $24,850 |
| Maximum | $65,298 | $85,578 |
| Range | $38,423 | $60,728 |
| Mean | $43,450 | $50,027 |
| Median | $43,514 | $50,986 |
| Interquartile 25% (IQ1) | $38,912 | $42,944 |
| Interquartile 75% (IQ3) | $47,991 | $56,219 |
| Interquartile Range (IQR) | $9,079 | $13,275 |
| Standard Deviation (Sample) | $8,689 | $11,396 |
| Standard Deviation (Population) | $8,513 | $11,323 |
Similar Demographics by Median Earnings
Demographics Similar to Puget Sound Salish by Median Earnings
In terms of median earnings, the demographic groups most similar to Puget Sound Salish are English ($46,334, a difference of 0.0%), Immigrants from Cameroon ($46,329, a difference of 0.010%), Colombian ($46,349, a difference of 0.040%), Swiss ($46,315, a difference of 0.040%), and French ($46,296, a difference of 0.080%).
| Demographics | Rating | Rank | Median Earnings |
| Ghanaians | 50.3 /100 | #173 | Average $46,440 |
| Scandinavians | 50.0 /100 | #174 | Average $46,433 |
| Basques | 48.8 /100 | #175 | Average $46,399 |
| Danes | 48.6 /100 | #176 | Average $46,392 |
| Belgians | 48.0 /100 | #177 | Average $46,375 |
| Colombians | 47.1 /100 | #178 | Average $46,349 |
| English | 46.5 /100 | #179 | Average $46,334 |
| Puget Sound Salish | 46.5 /100 | #180 | Average $46,333 |
| Immigrants | Cameroon | 46.4 /100 | #181 | Average $46,329 |
| Swiss | 45.9 /100 | #182 | Average $46,315 |
| French | 45.2 /100 | #183 | Average $46,296 |
| Immigrants | Kenya | 42.4 /100 | #184 | Average $46,214 |
| Uruguayans | 41.6 /100 | #185 | Average $46,190 |
| Vietnamese | 40.9 /100 | #186 | Average $46,172 |
| Iraqis | 39.9 /100 | #187 | Fair $46,140 |
Demographics Similar to Immigrants from Serbia by Median Earnings
In terms of median earnings, the demographic groups most similar to Immigrants from Serbia are Immigrants from Latvia ($51,555, a difference of 0.0%), Immigrants from Croatia ($51,581, a difference of 0.050%), Immigrants from Bolivia ($51,605, a difference of 0.090%), Immigrants from Eastern Europe ($51,624, a difference of 0.13%), and Immigrants from Pakistan ($51,693, a difference of 0.26%).
| Demographics | Rating | Rank | Median Earnings |
| Immigrants | Norway | 99.9 /100 | #53 | Exceptional $51,758 |
| Immigrants | Indonesia | 99.9 /100 | #54 | Exceptional $51,715 |
| Egyptians | 99.9 /100 | #55 | Exceptional $51,701 |
| Immigrants | Pakistan | 99.9 /100 | #56 | Exceptional $51,693 |
| Immigrants | Eastern Europe | 99.9 /100 | #57 | Exceptional $51,624 |
| Immigrants | Bolivia | 99.9 /100 | #58 | Exceptional $51,605 |
| Immigrants | Croatia | 99.9 /100 | #59 | Exceptional $51,581 |
| Immigrants | Serbia | 99.9 /100 | #60 | Exceptional $51,557 |
| Immigrants | Latvia | 99.9 /100 | #61 | Exceptional $51,555 |
| Immigrants | Romania | 99.9 /100 | #62 | Exceptional $51,337 |
| Immigrants | Bulgaria | 99.9 /100 | #63 | Exceptional $51,318 |
| New Zealanders | 99.9 /100 | #64 | Exceptional $51,246 |
| Greeks | 99.9 /100 | #65 | Exceptional $51,164 |
| Afghans | 99.9 /100 | #66 | Exceptional $51,112 |
| Immigrants | Spain | 99.9 /100 | #67 | Exceptional $51,092 |