Puget Sound Salish vs Immigrants from El Salvador Median Earnings
COMPARE
Puget Sound Salish
Immigrants from El Salvador
Median Earnings
Median Earnings Comparison
Puget Sound Salish
Immigrants from El Salvador
$46,333
MEDIAN EARNINGS
46.5/ 100
METRIC RATING
180th/ 347
METRIC RANK
$42,413
MEDIAN EARNINGS
0.4/ 100
METRIC RATING
274th/ 347
METRIC RANK
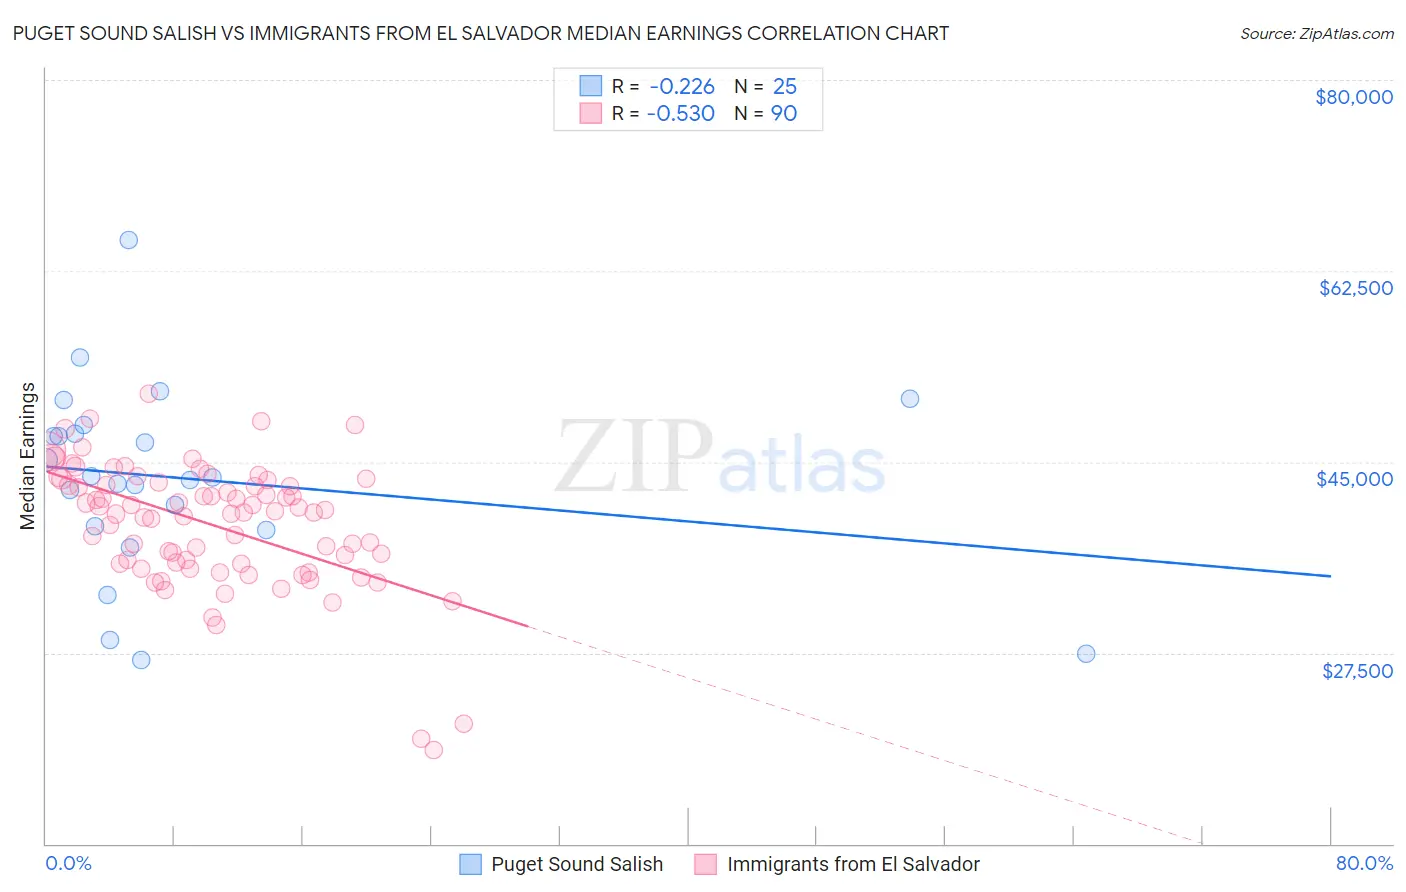
Puget Sound Salish vs Immigrants from El Salvador Median Earnings Correlation Chart
The statistical analysis conducted on geographies consisting of 46,155,746 people shows a weak negative correlation between the proportion of Puget Sound Salish and median earnings in the United States with a correlation coefficient (R) of -0.226 and weighted average of $46,333. Similarly, the statistical analysis conducted on geographies consisting of 357,819,610 people shows a substantial negative correlation between the proportion of Immigrants from El Salvador and median earnings in the United States with a correlation coefficient (R) of -0.530 and weighted average of $42,413, a difference of 9.2%.
Median Earnings Correlation Summary
| Measurement | Puget Sound Salish | Immigrants from El Salvador |
| Minimum | $26,875 | $18,605 |
| Maximum | $65,298 | $51,289 |
| Range | $38,423 | $32,684 |
| Mean | $43,450 | $39,285 |
| Median | $43,514 | $40,413 |
| Interquartile 25% (IQ1) | $38,912 | $35,635 |
| Interquartile 75% (IQ3) | $47,991 | $43,130 |
| Interquartile Range (IQR) | $9,079 | $7,494 |
| Standard Deviation (Sample) | $8,689 | $5,807 |
| Standard Deviation (Population) | $8,513 | $5,775 |
Similar Demographics by Median Earnings
Demographics Similar to Puget Sound Salish by Median Earnings
In terms of median earnings, the demographic groups most similar to Puget Sound Salish are English ($46,334, a difference of 0.0%), Immigrants from Cameroon ($46,329, a difference of 0.010%), Colombian ($46,349, a difference of 0.040%), Swiss ($46,315, a difference of 0.040%), and French ($46,296, a difference of 0.080%).
| Demographics | Rating | Rank | Median Earnings |
| Ghanaians | 50.3 /100 | #173 | Average $46,440 |
| Scandinavians | 50.0 /100 | #174 | Average $46,433 |
| Basques | 48.8 /100 | #175 | Average $46,399 |
| Danes | 48.6 /100 | #176 | Average $46,392 |
| Belgians | 48.0 /100 | #177 | Average $46,375 |
| Colombians | 47.1 /100 | #178 | Average $46,349 |
| English | 46.5 /100 | #179 | Average $46,334 |
| Puget Sound Salish | 46.5 /100 | #180 | Average $46,333 |
| Immigrants | Cameroon | 46.4 /100 | #181 | Average $46,329 |
| Swiss | 45.9 /100 | #182 | Average $46,315 |
| French | 45.2 /100 | #183 | Average $46,296 |
| Immigrants | Kenya | 42.4 /100 | #184 | Average $46,214 |
| Uruguayans | 41.6 /100 | #185 | Average $46,190 |
| Vietnamese | 40.9 /100 | #186 | Average $46,172 |
| Iraqis | 39.9 /100 | #187 | Fair $46,140 |
Demographics Similar to Immigrants from El Salvador by Median Earnings
In terms of median earnings, the demographic groups most similar to Immigrants from El Salvador are Immigrants from Dominica ($42,420, a difference of 0.020%), Iroquois ($42,430, a difference of 0.040%), Immigrants from Belize ($42,339, a difference of 0.18%), Spanish American ($42,316, a difference of 0.23%), and Central American ($42,280, a difference of 0.32%).
| Demographics | Rating | Rank | Median Earnings |
| Cree | 0.6 /100 | #267 | Tragic $42,777 |
| Americans | 0.6 /100 | #268 | Tragic $42,742 |
| Belizeans | 0.5 /100 | #269 | Tragic $42,702 |
| Osage | 0.5 /100 | #270 | Tragic $42,651 |
| Pennsylvania Germans | 0.5 /100 | #271 | Tragic $42,615 |
| Iroquois | 0.4 /100 | #272 | Tragic $42,430 |
| Immigrants | Dominica | 0.4 /100 | #273 | Tragic $42,420 |
| Immigrants | El Salvador | 0.4 /100 | #274 | Tragic $42,413 |
| Immigrants | Belize | 0.3 /100 | #275 | Tragic $42,339 |
| Spanish Americans | 0.3 /100 | #276 | Tragic $42,316 |
| Central Americans | 0.3 /100 | #277 | Tragic $42,280 |
| Cajuns | 0.3 /100 | #278 | Tragic $42,189 |
| Colville | 0.2 /100 | #279 | Tragic $42,151 |
| Hmong | 0.2 /100 | #280 | Tragic $42,111 |
| Marshallese | 0.2 /100 | #281 | Tragic $41,969 |