Puget Sound Salish vs Immigrants from Lebanon Median Earnings
COMPARE
Puget Sound Salish
Immigrants from Lebanon
Median Earnings
Median Earnings Comparison
Puget Sound Salish
Immigrants from Lebanon
$46,333
MEDIAN EARNINGS
46.5/ 100
METRIC RATING
180th/ 347
METRIC RANK
$49,682
MEDIAN EARNINGS
99.0/ 100
METRIC RATING
96th/ 347
METRIC RANK
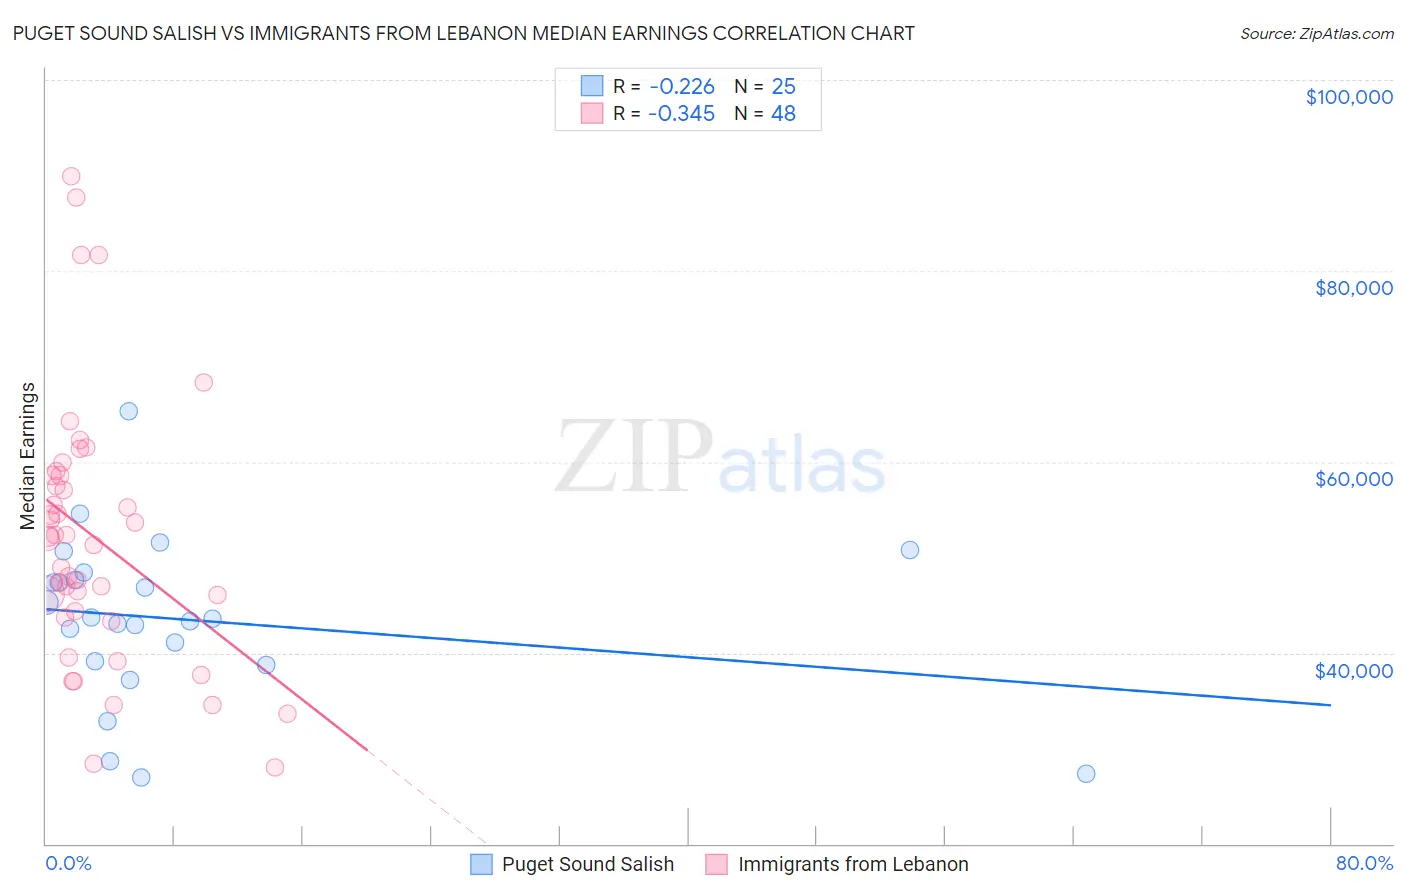
Puget Sound Salish vs Immigrants from Lebanon Median Earnings Correlation Chart
The statistical analysis conducted on geographies consisting of 46,155,746 people shows a weak negative correlation between the proportion of Puget Sound Salish and median earnings in the United States with a correlation coefficient (R) of -0.226 and weighted average of $46,333. Similarly, the statistical analysis conducted on geographies consisting of 217,150,005 people shows a mild negative correlation between the proportion of Immigrants from Lebanon and median earnings in the United States with a correlation coefficient (R) of -0.345 and weighted average of $49,682, a difference of 7.2%.
Median Earnings Correlation Summary
| Measurement | Puget Sound Salish | Immigrants from Lebanon |
| Minimum | $26,875 | $27,932 |
| Maximum | $65,298 | $89,953 |
| Range | $38,423 | $62,021 |
| Mean | $43,450 | $52,128 |
| Median | $43,514 | $52,076 |
| Interquartile 25% (IQ1) | $38,912 | $44,033 |
| Interquartile 75% (IQ3) | $47,991 | $58,565 |
| Interquartile Range (IQR) | $9,079 | $14,532 |
| Standard Deviation (Sample) | $8,689 | $13,798 |
| Standard Deviation (Population) | $8,513 | $13,653 |
Similar Demographics by Median Earnings
Demographics Similar to Puget Sound Salish by Median Earnings
In terms of median earnings, the demographic groups most similar to Puget Sound Salish are English ($46,334, a difference of 0.0%), Immigrants from Cameroon ($46,329, a difference of 0.010%), Colombian ($46,349, a difference of 0.040%), Swiss ($46,315, a difference of 0.040%), and French ($46,296, a difference of 0.080%).
| Demographics | Rating | Rank | Median Earnings |
| Ghanaians | 50.3 /100 | #173 | Average $46,440 |
| Scandinavians | 50.0 /100 | #174 | Average $46,433 |
| Basques | 48.8 /100 | #175 | Average $46,399 |
| Danes | 48.6 /100 | #176 | Average $46,392 |
| Belgians | 48.0 /100 | #177 | Average $46,375 |
| Colombians | 47.1 /100 | #178 | Average $46,349 |
| English | 46.5 /100 | #179 | Average $46,334 |
| Puget Sound Salish | 46.5 /100 | #180 | Average $46,333 |
| Immigrants | Cameroon | 46.4 /100 | #181 | Average $46,329 |
| Swiss | 45.9 /100 | #182 | Average $46,315 |
| French | 45.2 /100 | #183 | Average $46,296 |
| Immigrants | Kenya | 42.4 /100 | #184 | Average $46,214 |
| Uruguayans | 41.6 /100 | #185 | Average $46,190 |
| Vietnamese | 40.9 /100 | #186 | Average $46,172 |
| Iraqis | 39.9 /100 | #187 | Fair $46,140 |
Demographics Similar to Immigrants from Lebanon by Median Earnings
In terms of median earnings, the demographic groups most similar to Immigrants from Lebanon are Immigrants from North Macedonia ($49,658, a difference of 0.050%), Immigrants from Northern Africa ($49,648, a difference of 0.070%), Immigrants from Afghanistan ($49,645, a difference of 0.070%), Immigrants from England ($49,722, a difference of 0.080%), and Croatian ($49,724, a difference of 0.090%).
| Demographics | Rating | Rank | Median Earnings |
| Immigrants | North America | 99.4 /100 | #89 | Exceptional $50,108 |
| Italians | 99.3 /100 | #90 | Exceptional $49,915 |
| Macedonians | 99.2 /100 | #91 | Exceptional $49,893 |
| Immigrants | Argentina | 99.2 /100 | #92 | Exceptional $49,841 |
| Armenians | 99.1 /100 | #93 | Exceptional $49,804 |
| Croatians | 99.0 /100 | #94 | Exceptional $49,724 |
| Immigrants | England | 99.0 /100 | #95 | Exceptional $49,722 |
| Immigrants | Lebanon | 99.0 /100 | #96 | Exceptional $49,682 |
| Immigrants | North Macedonia | 98.9 /100 | #97 | Exceptional $49,658 |
| Immigrants | Northern Africa | 98.9 /100 | #98 | Exceptional $49,648 |
| Immigrants | Afghanistan | 98.9 /100 | #99 | Exceptional $49,645 |
| Immigrants | Poland | 98.9 /100 | #100 | Exceptional $49,633 |
| Jordanians | 98.9 /100 | #101 | Exceptional $49,632 |
| Ethiopians | 98.8 /100 | #102 | Exceptional $49,572 |
| Austrians | 98.7 /100 | #103 | Exceptional $49,501 |