Central American vs French American Indian Median Household Income
COMPARE
Central American
French American Indian
Median Household Income
Median Household Income Comparison
Central Americans
French American Indians
$78,803
MEDIAN HOUSEHOLD INCOME
1.7/ 100
METRIC RATING
246th/ 347
METRIC RANK
$76,387
MEDIAN HOUSEHOLD INCOME
0.4/ 100
METRIC RATING
262nd/ 347
METRIC RANK
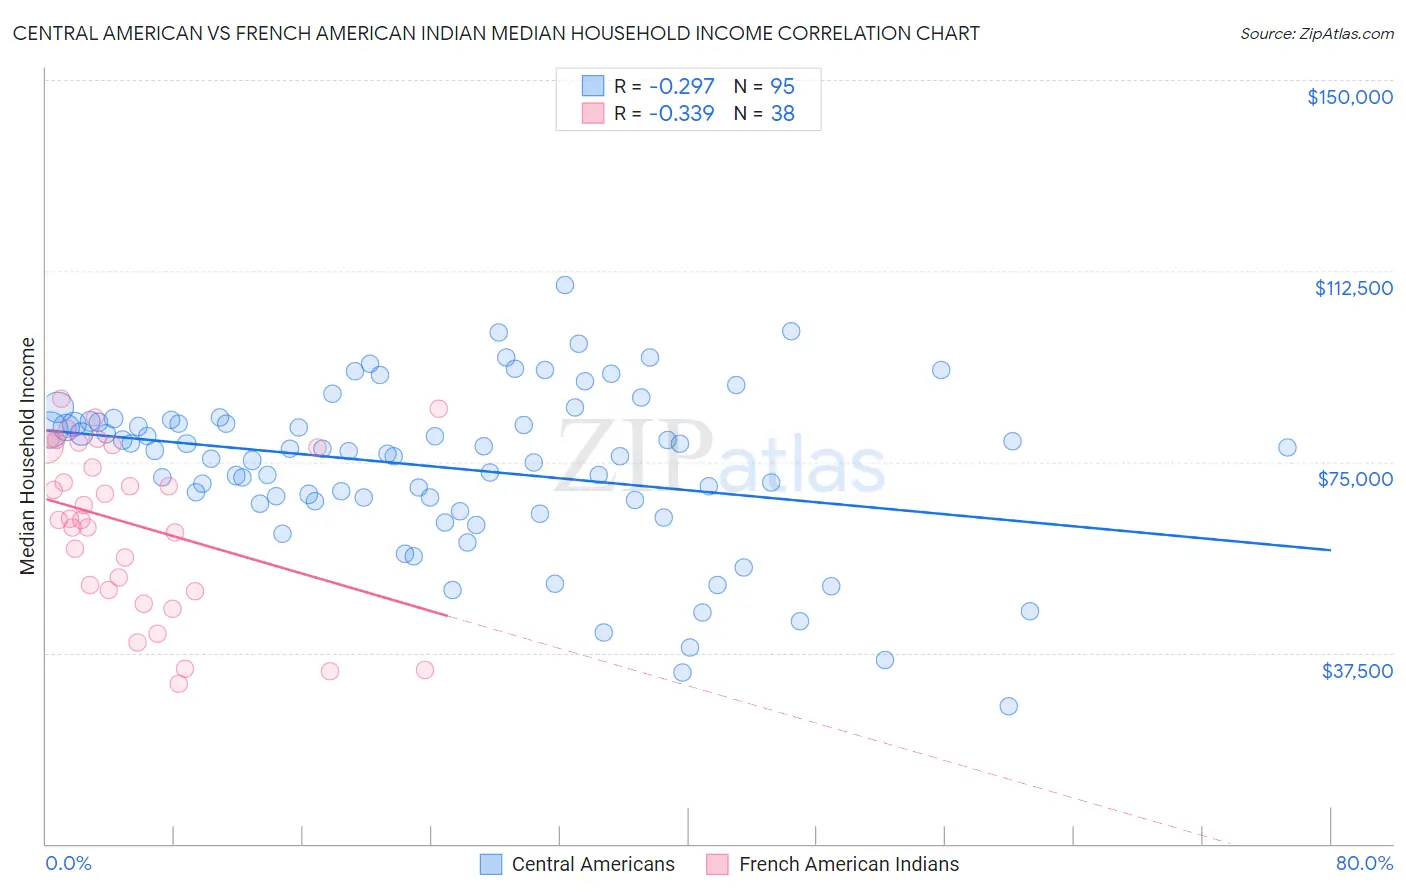
Central American vs French American Indian Median Household Income Correlation Chart
The statistical analysis conducted on geographies consisting of 503,881,037 people shows a weak negative correlation between the proportion of Central Americans and median household income in the United States with a correlation coefficient (R) of -0.297 and weighted average of $78,803. Similarly, the statistical analysis conducted on geographies consisting of 131,952,383 people shows a mild negative correlation between the proportion of French American Indians and median household income in the United States with a correlation coefficient (R) of -0.339 and weighted average of $76,387, a difference of 3.2%.
Median Household Income Correlation Summary
| Measurement | Central American | French American Indian |
| Minimum | $26,979 | $31,325 |
| Maximum | $109,623 | $87,295 |
| Range | $82,644 | $55,970 |
| Mean | $73,852 | $62,652 |
| Median | $77,087 | $63,795 |
| Interquartile 25% (IQ1) | $67,287 | $49,785 |
| Interquartile 75% (IQ3) | $82,754 | $78,132 |
| Interquartile Range (IQR) | $15,467 | $28,346 |
| Standard Deviation (Sample) | $15,929 | $16,205 |
| Standard Deviation (Population) | $15,845 | $15,990 |
Demographics Similar to Central Americans and French American Indians by Median Household Income
In terms of median household income, the demographic groups most similar to Central Americans are Inupiat ($78,841, a difference of 0.050%), Immigrants from Burma/Myanmar ($78,682, a difference of 0.15%), Marshallese ($78,930, a difference of 0.16%), Sudanese ($78,529, a difference of 0.35%), and West Indian ($78,455, a difference of 0.44%). Similarly, the demographic groups most similar to French American Indians are Alaskan Athabascan ($76,383, a difference of 0.010%), Immigrants from Grenada ($76,517, a difference of 0.17%), Jamaican ($76,583, a difference of 0.26%), Spanish American Indian ($76,670, a difference of 0.37%), and Immigrants from Nicaragua ($76,784, a difference of 0.52%).
| Demographics | Rating | Rank | Median Household Income |
| Marshallese | 1.9 /100 | #244 | Tragic $78,930 |
| Inupiat | 1.8 /100 | #245 | Tragic $78,841 |
| Central Americans | 1.7 /100 | #246 | Tragic $78,803 |
| Immigrants | Burma/Myanmar | 1.6 /100 | #247 | Tragic $78,682 |
| Sudanese | 1.5 /100 | #248 | Tragic $78,529 |
| West Indians | 1.4 /100 | #249 | Tragic $78,455 |
| Immigrants | Laos | 1.3 /100 | #250 | Tragic $78,327 |
| Mexican American Indians | 1.2 /100 | #251 | Tragic $78,166 |
| Immigrants | West Indies | 1.0 /100 | #252 | Tragic $77,956 |
| Immigrants | St. Vincent and the Grenadines | 0.9 /100 | #253 | Tragic $77,690 |
| Sub-Saharan Africans | 0.8 /100 | #254 | Tragic $77,631 |
| Immigrants | Middle Africa | 0.8 /100 | #255 | Tragic $77,559 |
| Belizeans | 0.6 /100 | #256 | Tragic $77,028 |
| Immigrants | Senegal | 0.5 /100 | #257 | Tragic $76,915 |
| Immigrants | Nicaragua | 0.5 /100 | #258 | Tragic $76,784 |
| Spanish American Indians | 0.4 /100 | #259 | Tragic $76,670 |
| Jamaicans | 0.4 /100 | #260 | Tragic $76,583 |
| Immigrants | Grenada | 0.4 /100 | #261 | Tragic $76,517 |
| French American Indians | 0.4 /100 | #262 | Tragic $76,387 |
| Alaskan Athabascans | 0.4 /100 | #263 | Tragic $76,383 |
| Guatemalans | 0.3 /100 | #264 | Tragic $75,961 |