Potawatomi vs Immigrants from Russia Median Household Income
COMPARE
Potawatomi
Immigrants from Russia
Median Household Income
Median Household Income Comparison
Potawatomi
Immigrants from Russia
$72,576
MEDIAN HOUSEHOLD INCOME
0.0/ 100
METRIC RATING
306th/ 347
METRIC RANK
$96,378
MEDIAN HOUSEHOLD INCOME
99.9/ 100
METRIC RATING
47th/ 347
METRIC RANK
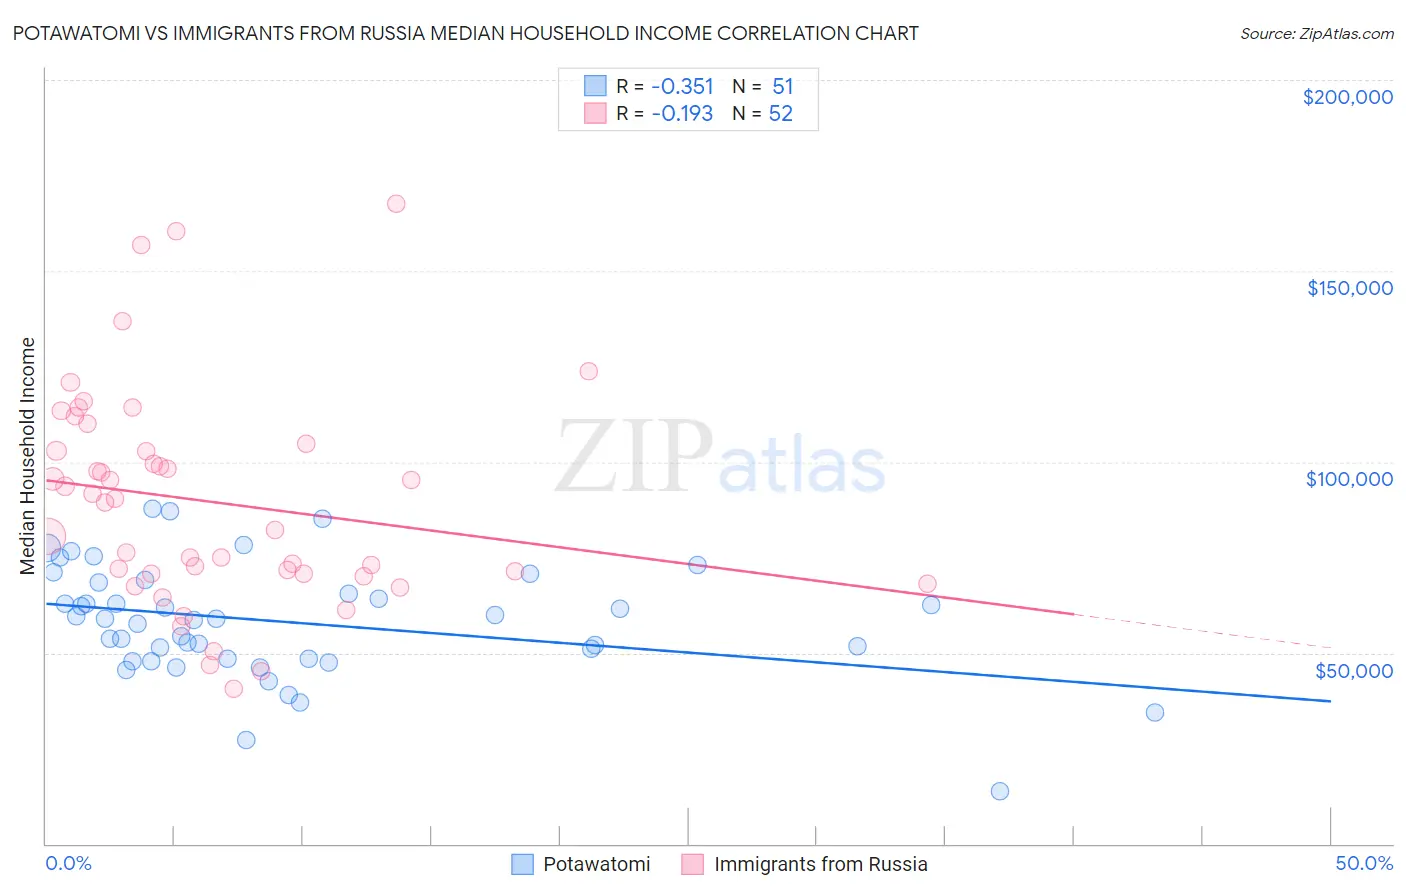
Potawatomi vs Immigrants from Russia Median Household Income Correlation Chart
The statistical analysis conducted on geographies consisting of 117,750,018 people shows a mild negative correlation between the proportion of Potawatomi and median household income in the United States with a correlation coefficient (R) of -0.351 and weighted average of $72,576. Similarly, the statistical analysis conducted on geographies consisting of 347,675,291 people shows a poor negative correlation between the proportion of Immigrants from Russia and median household income in the United States with a correlation coefficient (R) of -0.193 and weighted average of $96,378, a difference of 32.8%.
Median Household Income Correlation Summary
| Measurement | Potawatomi | Immigrants from Russia |
| Minimum | $13,750 | $40,467 |
| Maximum | $87,880 | $167,656 |
| Range | $74,130 | $127,189 |
| Mean | $58,038 | $89,609 |
| Median | $58,924 | $89,857 |
| Interquartile 25% (IQ1) | $48,403 | $70,618 |
| Interquartile 75% (IQ3) | $68,477 | $103,868 |
| Interquartile Range (IQR) | $20,074 | $33,250 |
| Standard Deviation (Sample) | $14,790 | $28,243 |
| Standard Deviation (Population) | $14,645 | $27,970 |
Similar Demographics by Median Household Income
Demographics Similar to Potawatomi by Median Household Income
In terms of median household income, the demographic groups most similar to Potawatomi are Honduran ($72,588, a difference of 0.020%), Immigrants from Haiti ($72,599, a difference of 0.030%), African ($72,650, a difference of 0.10%), Shoshone ($72,660, a difference of 0.12%), and Cherokee ($72,682, a difference of 0.15%).
| Demographics | Rating | Rank | Median Household Income |
| Indonesians | 0.0 /100 | #299 | Tragic $72,856 |
| Immigrants | Dominica | 0.0 /100 | #300 | Tragic $72,760 |
| Cherokee | 0.0 /100 | #301 | Tragic $72,682 |
| Shoshone | 0.0 /100 | #302 | Tragic $72,660 |
| Africans | 0.0 /100 | #303 | Tragic $72,650 |
| Immigrants | Haiti | 0.0 /100 | #304 | Tragic $72,599 |
| Hondurans | 0.0 /100 | #305 | Tragic $72,588 |
| Potawatomi | 0.0 /100 | #306 | Tragic $72,576 |
| Ute | 0.0 /100 | #307 | Tragic $72,402 |
| Yakama | 0.0 /100 | #308 | Tragic $72,225 |
| Immigrants | Caribbean | 0.0 /100 | #309 | Tragic $71,860 |
| U.S. Virgin Islanders | 0.0 /100 | #310 | Tragic $71,853 |
| Immigrants | Zaire | 0.0 /100 | #311 | Tragic $71,801 |
| Immigrants | Honduras | 0.0 /100 | #312 | Tragic $71,452 |
| Immigrants | Bahamas | 0.0 /100 | #313 | Tragic $71,349 |
Demographics Similar to Immigrants from Russia by Median Household Income
In terms of median household income, the demographic groups most similar to Immigrants from Russia are Cambodian ($96,324, a difference of 0.060%), Immigrants from Malaysia ($96,292, a difference of 0.090%), Bulgarian ($96,290, a difference of 0.090%), Australian ($96,490, a difference of 0.12%), and Israeli ($96,552, a difference of 0.18%).
| Demographics | Rating | Rank | Median Household Income |
| Maltese | 100.0 /100 | #40 | Exceptional $97,015 |
| Immigrants | Turkey | 100.0 /100 | #41 | Exceptional $96,964 |
| Immigrants | Lithuania | 99.9 /100 | #42 | Exceptional $96,836 |
| Immigrants | France | 99.9 /100 | #43 | Exceptional $96,743 |
| Immigrants | Greece | 99.9 /100 | #44 | Exceptional $96,675 |
| Israelis | 99.9 /100 | #45 | Exceptional $96,552 |
| Australians | 99.9 /100 | #46 | Exceptional $96,490 |
| Immigrants | Russia | 99.9 /100 | #47 | Exceptional $96,378 |
| Cambodians | 99.9 /100 | #48 | Exceptional $96,324 |
| Immigrants | Malaysia | 99.9 /100 | #49 | Exceptional $96,292 |
| Bulgarians | 99.9 /100 | #50 | Exceptional $96,290 |
| Estonians | 99.9 /100 | #51 | Exceptional $95,930 |
| Immigrants | South Africa | 99.9 /100 | #52 | Exceptional $95,800 |
| Paraguayans | 99.9 /100 | #53 | Exceptional $95,737 |
| Egyptians | 99.9 /100 | #54 | Exceptional $95,673 |