Potawatomi vs Immigrants from Bulgaria Median Household Income
COMPARE
Potawatomi
Immigrants from Bulgaria
Median Household Income
Median Household Income Comparison
Potawatomi
Immigrants from Bulgaria
$72,576
MEDIAN HOUSEHOLD INCOME
0.0/ 100
METRIC RATING
306th/ 347
METRIC RANK
$93,148
MEDIAN HOUSEHOLD INCOME
99.4/ 100
METRIC RATING
78th/ 347
METRIC RANK
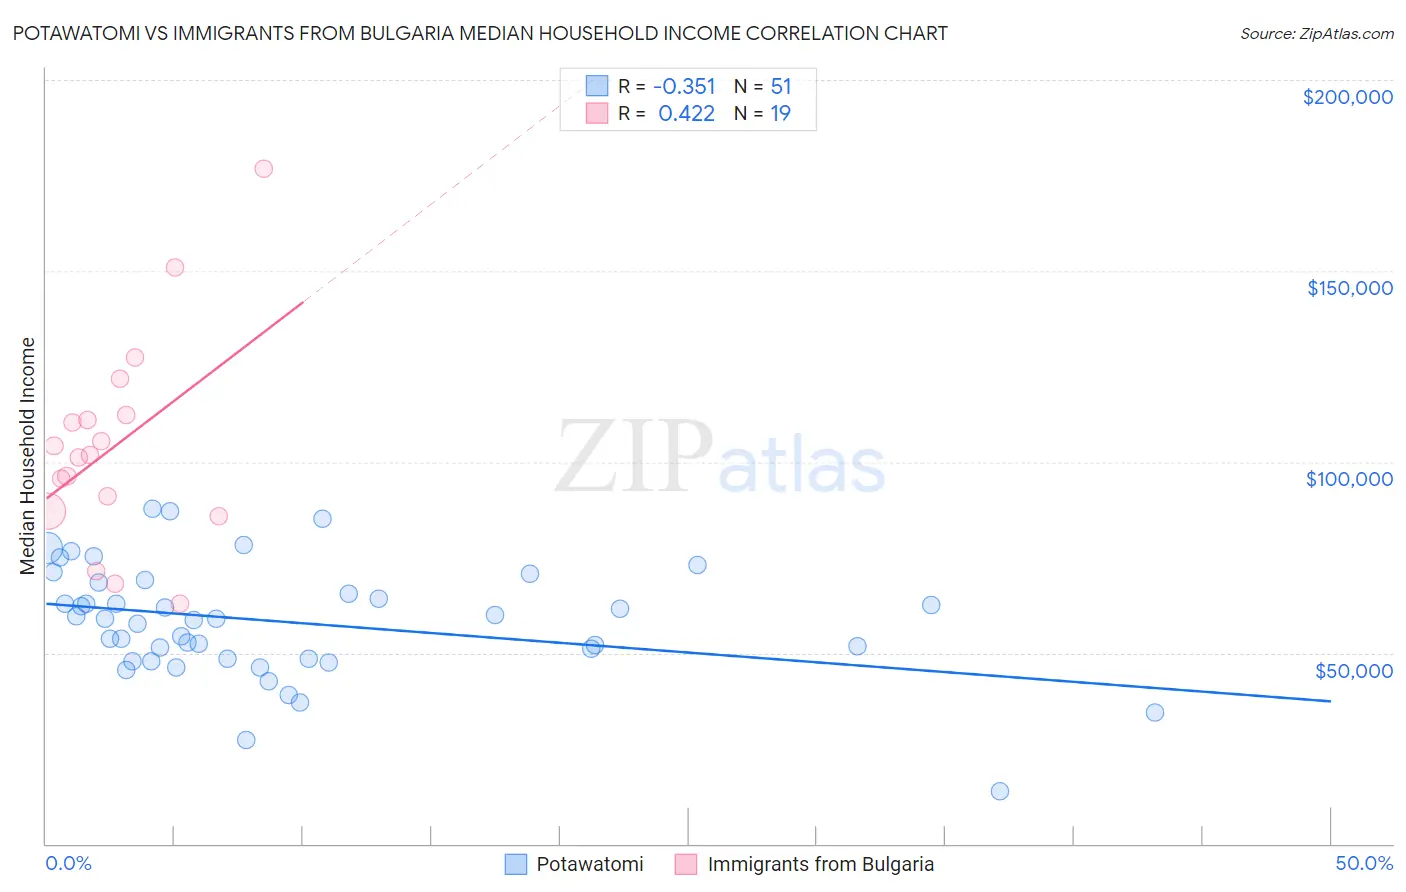
Potawatomi vs Immigrants from Bulgaria Median Household Income Correlation Chart
The statistical analysis conducted on geographies consisting of 117,750,018 people shows a mild negative correlation between the proportion of Potawatomi and median household income in the United States with a correlation coefficient (R) of -0.351 and weighted average of $72,576. Similarly, the statistical analysis conducted on geographies consisting of 172,532,880 people shows a moderate positive correlation between the proportion of Immigrants from Bulgaria and median household income in the United States with a correlation coefficient (R) of 0.422 and weighted average of $93,148, a difference of 28.3%.
Median Household Income Correlation Summary
| Measurement | Potawatomi | Immigrants from Bulgaria |
| Minimum | $13,750 | $62,888 |
| Maximum | $87,880 | $176,736 |
| Range | $74,130 | $113,848 |
| Mean | $58,038 | $104,276 |
| Median | $58,924 | $101,764 |
| Interquartile 25% (IQ1) | $48,403 | $87,129 |
| Interquartile 75% (IQ3) | $68,477 | $112,416 |
| Interquartile Range (IQR) | $20,074 | $25,288 |
| Standard Deviation (Sample) | $14,790 | $27,381 |
| Standard Deviation (Population) | $14,645 | $26,651 |
Similar Demographics by Median Household Income
Demographics Similar to Potawatomi by Median Household Income
In terms of median household income, the demographic groups most similar to Potawatomi are Honduran ($72,588, a difference of 0.020%), Immigrants from Haiti ($72,599, a difference of 0.030%), African ($72,650, a difference of 0.10%), Shoshone ($72,660, a difference of 0.12%), and Cherokee ($72,682, a difference of 0.15%).
| Demographics | Rating | Rank | Median Household Income |
| Indonesians | 0.0 /100 | #299 | Tragic $72,856 |
| Immigrants | Dominica | 0.0 /100 | #300 | Tragic $72,760 |
| Cherokee | 0.0 /100 | #301 | Tragic $72,682 |
| Shoshone | 0.0 /100 | #302 | Tragic $72,660 |
| Africans | 0.0 /100 | #303 | Tragic $72,650 |
| Immigrants | Haiti | 0.0 /100 | #304 | Tragic $72,599 |
| Hondurans | 0.0 /100 | #305 | Tragic $72,588 |
| Potawatomi | 0.0 /100 | #306 | Tragic $72,576 |
| Ute | 0.0 /100 | #307 | Tragic $72,402 |
| Yakama | 0.0 /100 | #308 | Tragic $72,225 |
| Immigrants | Caribbean | 0.0 /100 | #309 | Tragic $71,860 |
| U.S. Virgin Islanders | 0.0 /100 | #310 | Tragic $71,853 |
| Immigrants | Zaire | 0.0 /100 | #311 | Tragic $71,801 |
| Immigrants | Honduras | 0.0 /100 | #312 | Tragic $71,452 |
| Immigrants | Bahamas | 0.0 /100 | #313 | Tragic $71,349 |
Demographics Similar to Immigrants from Bulgaria by Median Household Income
In terms of median household income, the demographic groups most similar to Immigrants from Bulgaria are Sri Lankan ($93,093, a difference of 0.060%), Tongan ($93,076, a difference of 0.080%), Immigrants from Eastern Europe ($93,051, a difference of 0.10%), Immigrants from Afghanistan ($93,375, a difference of 0.24%), and South African ($93,379, a difference of 0.25%).
| Demographics | Rating | Rank | Median Household Income |
| Immigrants | Philippines | 99.6 /100 | #71 | Exceptional $93,899 |
| Lithuanians | 99.6 /100 | #72 | Exceptional $93,852 |
| Immigrants | Egypt | 99.6 /100 | #73 | Exceptional $93,700 |
| Immigrants | Latvia | 99.6 /100 | #74 | Exceptional $93,602 |
| Immigrants | Italy | 99.5 /100 | #75 | Exceptional $93,465 |
| South Africans | 99.5 /100 | #76 | Exceptional $93,379 |
| Immigrants | Afghanistan | 99.5 /100 | #77 | Exceptional $93,375 |
| Immigrants | Bulgaria | 99.4 /100 | #78 | Exceptional $93,148 |
| Sri Lankans | 99.4 /100 | #79 | Exceptional $93,093 |
| Tongans | 99.4 /100 | #80 | Exceptional $93,076 |
| Immigrants | Eastern Europe | 99.4 /100 | #81 | Exceptional $93,051 |
| Immigrants | Spain | 99.3 /100 | #82 | Exceptional $92,732 |
| Italians | 99.1 /100 | #83 | Exceptional $92,475 |
| Immigrants | Argentina | 99.1 /100 | #84 | Exceptional $92,417 |
| Immigrants | Croatia | 99.0 /100 | #85 | Exceptional $92,225 |